The Weakest Link
Diagnosing and repairing systemic risk in Single Room Occupancy buildings
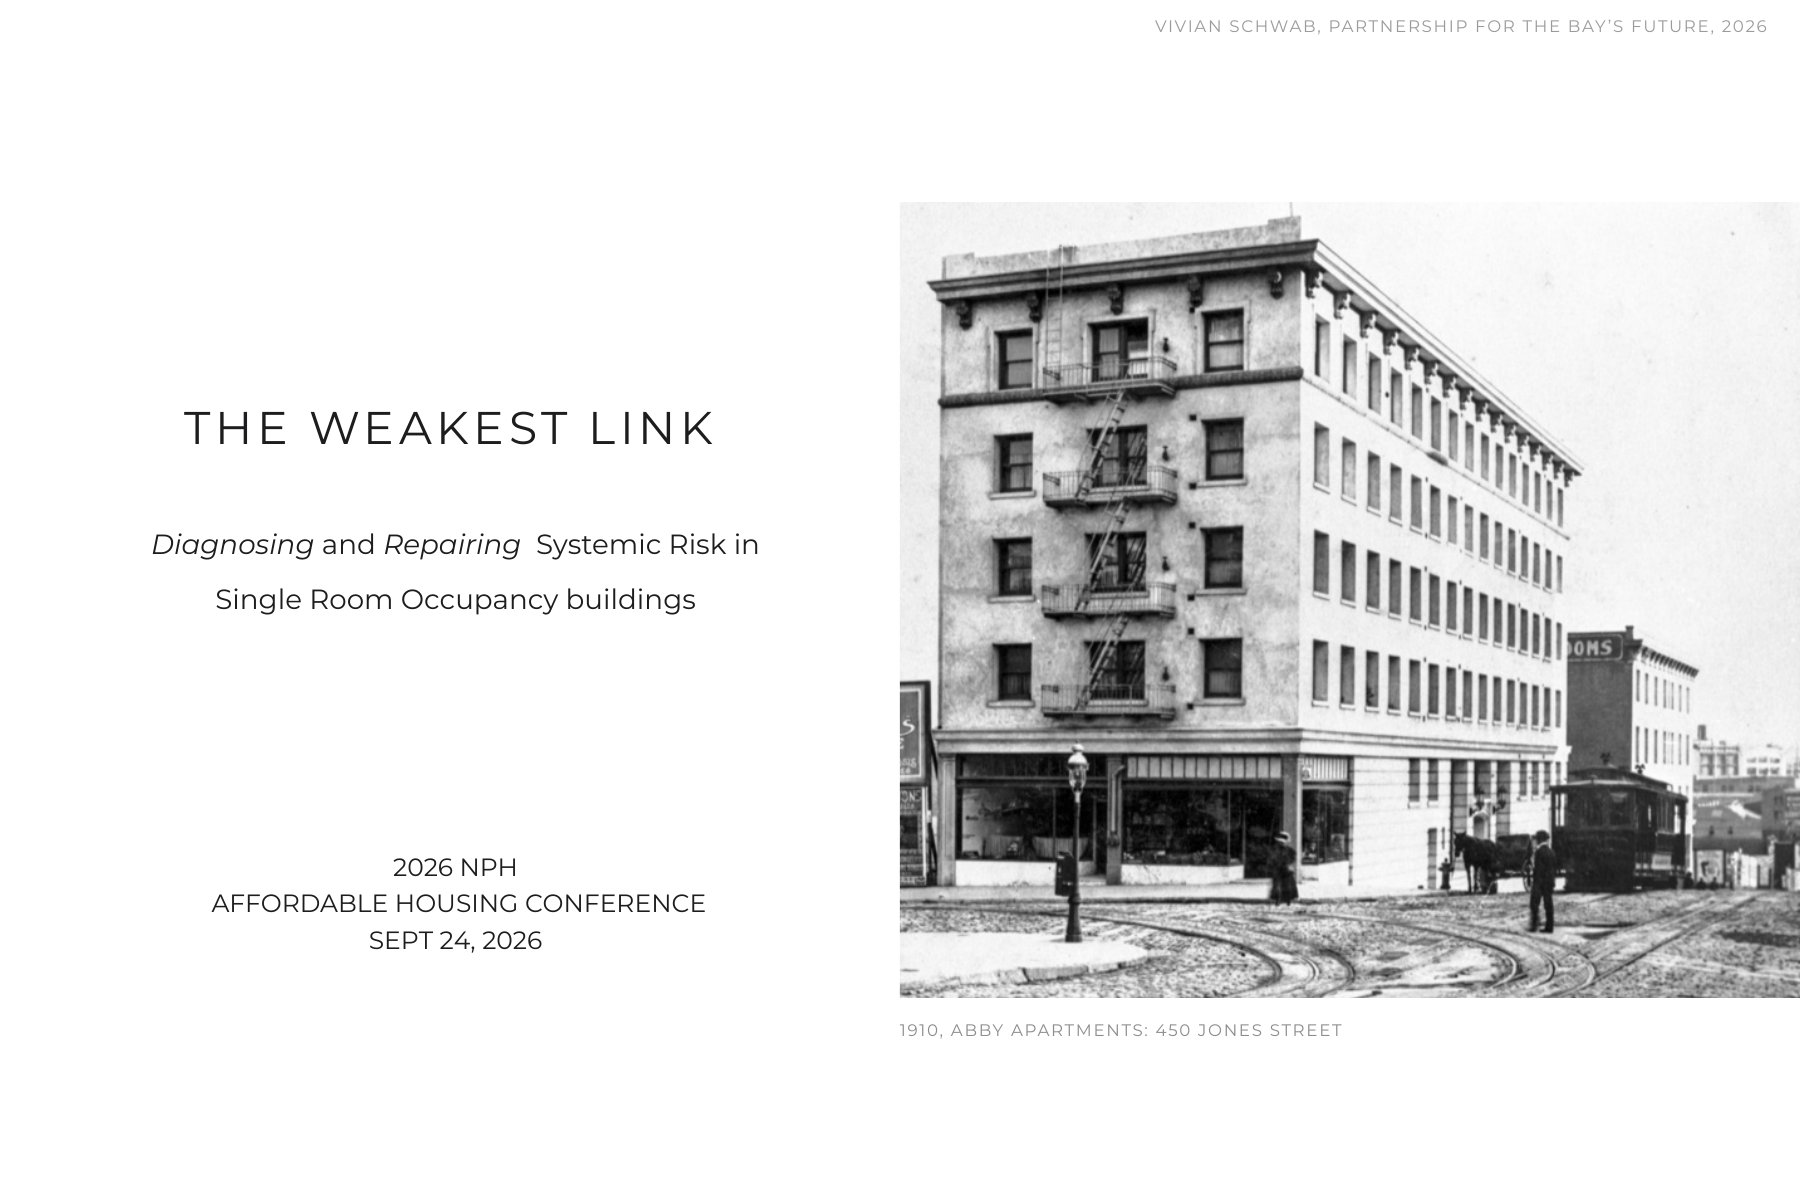
Over the past two years I've been studying San Francisco's single-room-occupancy hotels. That work has included more than 60 interviews across affordable housing development, property management, asset management, supportive services, behavioral health, and city government, and with the residents and staff who live and work in these buildings.
I started out thinking I was studying a straightforward preservation problem: aging buildings, low-income tenants, capital needs, and rapidly rising operating costs. But the deeper I got, the less the problems stayed in separate categories. A capital problem would turn out to have an operating component. An operating problem would have a service component. A service problem would become a property-management problem, and sometimes that crisis would reveal a health or disability need that had gone unaddressed for months or years.
When one part of the system is under-resourced, the cost doesn't disappear. It moves.
A word on the title. By "weakest link" I don't mean a building, a program, or a population. I mean the links themselves: the connections between financing, services, and community. That's where things break, and that's where the repair has to happen.
The panel
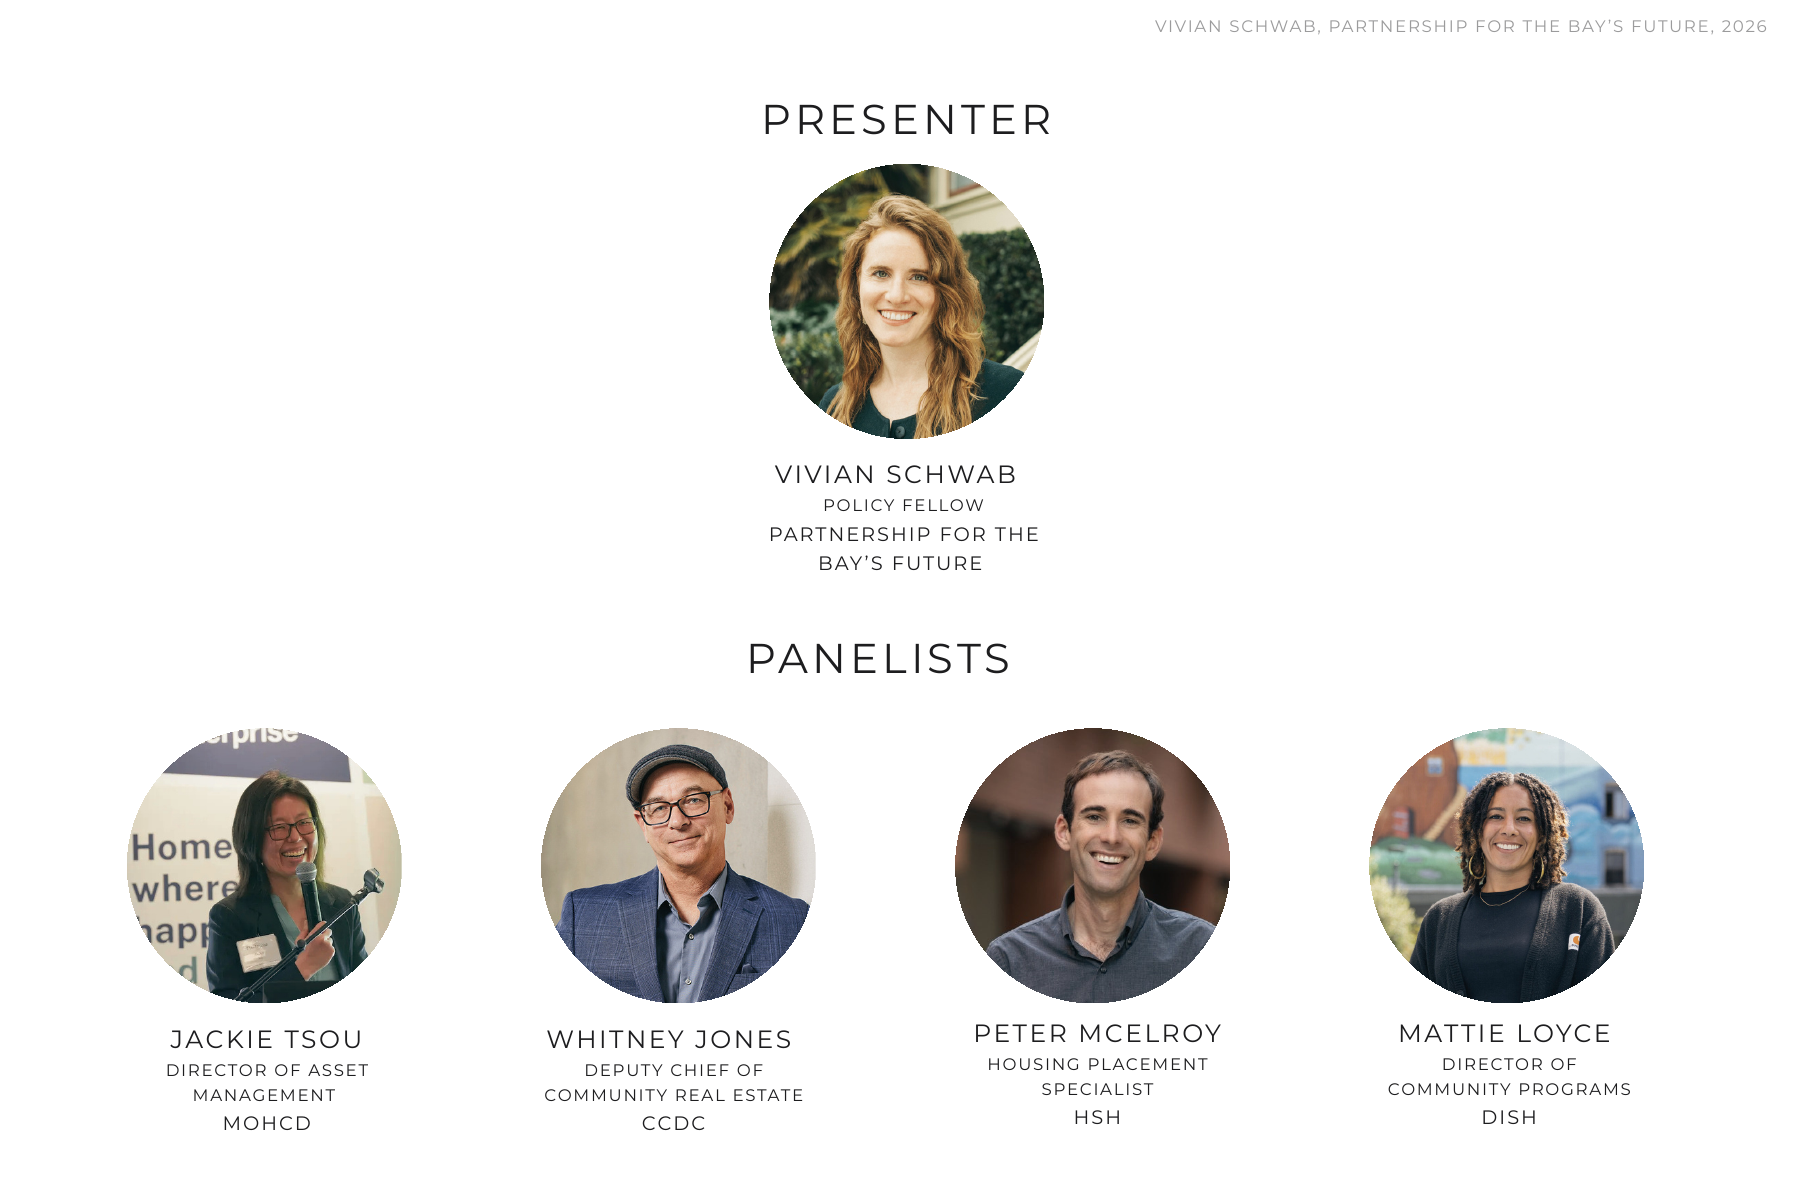
Four practitioners, each of whom sees a different part of this system up close. Rather than four separate presentations, they joined the conversation as it moved through the financials, the services, and the communities that define an SRO.
- Jackie Tsou
Director of Asset Management, Mayor's Office of Housing and Community Development. Monitors financial performance across the entire portfolio: the funder's side of the balance sheet. - Whitney Jones
Deputy Chief of Community Real Estate, Chinatown Community Development Center. Oversees a portfolio of SROs and makes the financials hold up building by building: the owner's side. - Peter McElroy
Housing Placement Specialist, Department of Homelessness and Supportive Housing. Inside the process that decides who is matched to which building. - Mattie Loyce
Director of Community Programs, DISH (Delivering Innovation in Supportive Housing). Works on keeping the building's community stable and resourced.
Investment thesis
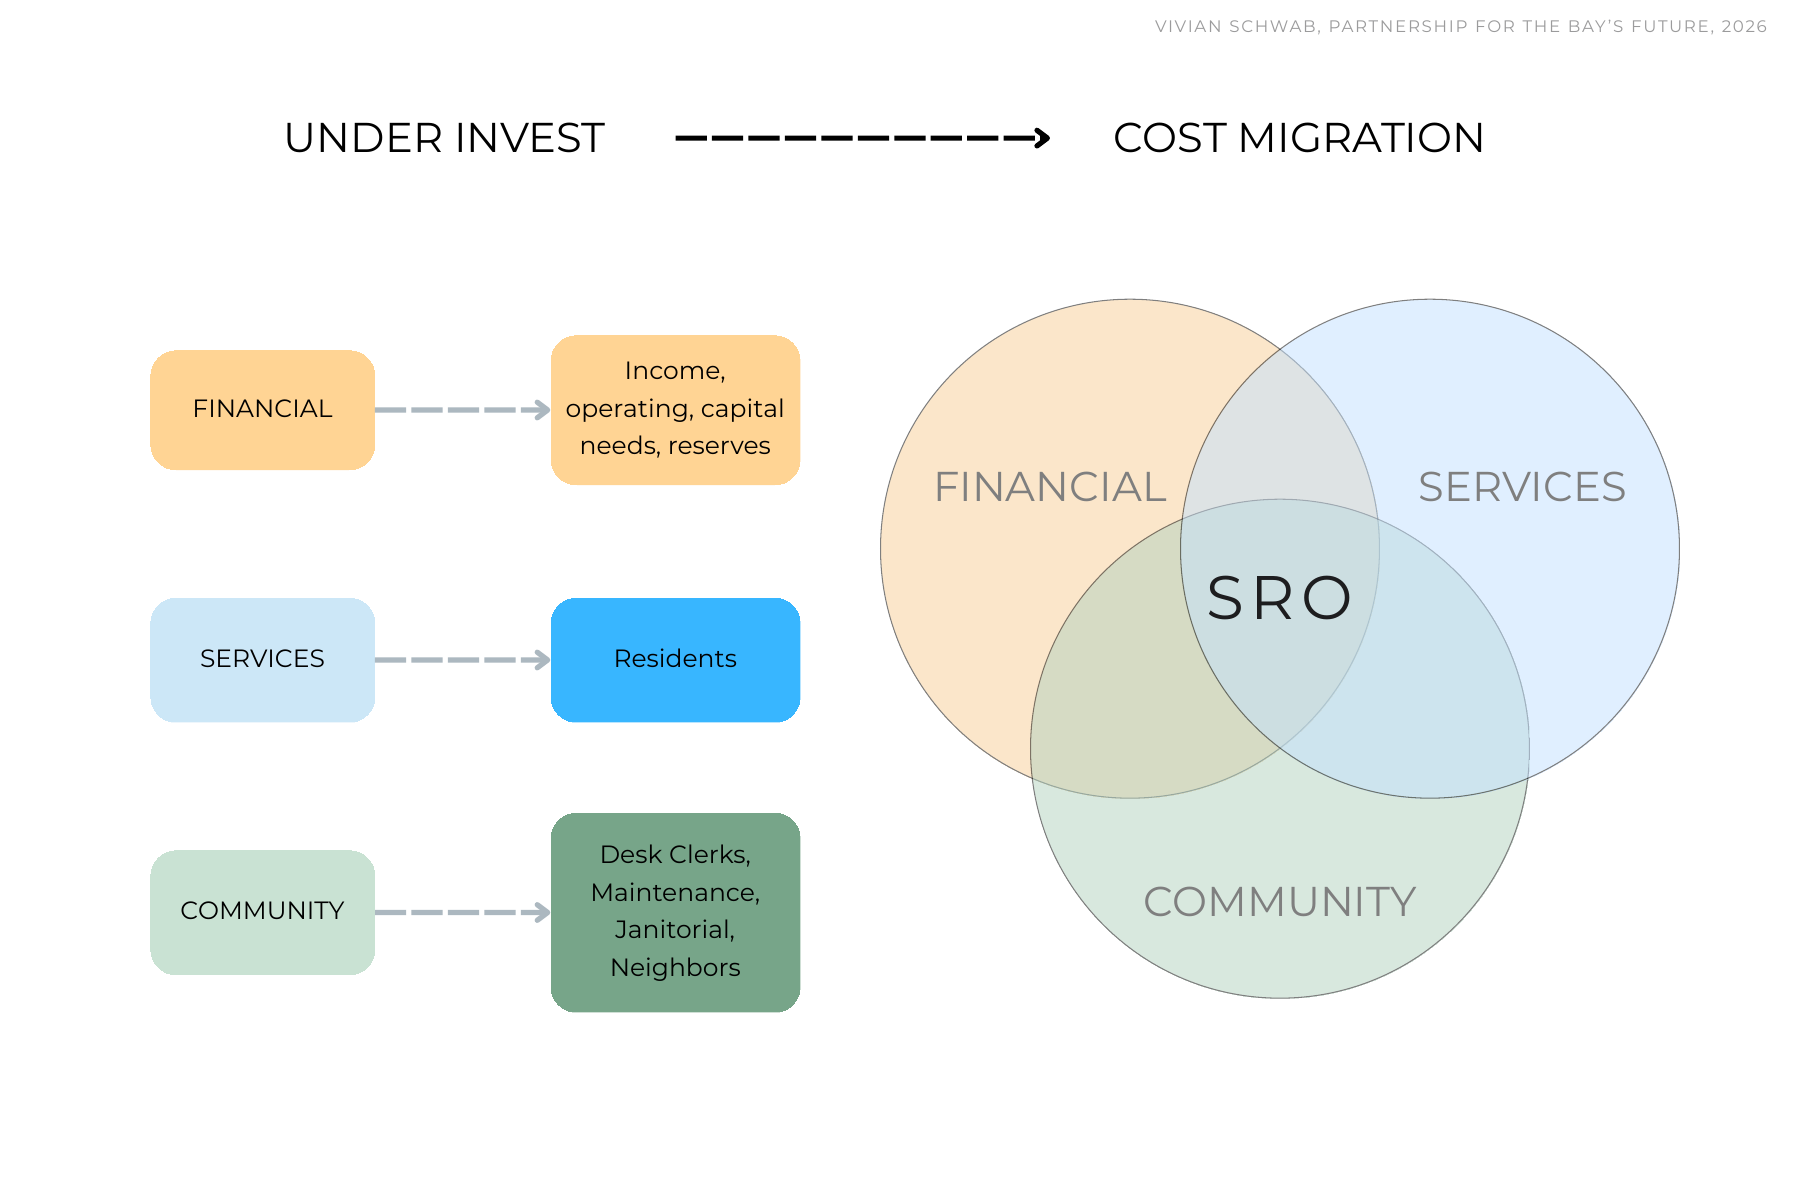
Publicly funded SROs contain three interdependent systems, and underfunding one becomes a hidden cost in another.
Financials. The one our industry knows best: rent and subsidy coming in, operating costs and debt service going out, the reserves that absorb shocks, and the capital that recapitalizes a building and funds end-of-life upgrades. Is the building getting the ongoing investment it needs to operate and stay healthy?
Services. The "supportive" piece of permanent supportive housing. Are the people living in the buildings getting the support they need to become stable and remain housed?
Community. The people who work and live in these buildings: frontline staff, property managers, desk clerks, janitors, and the residents themselves. Are they resourced for what a high-acuity environment asks of them?
We tend to fund these separately, but the building doesn't experience them separately.
How we got here
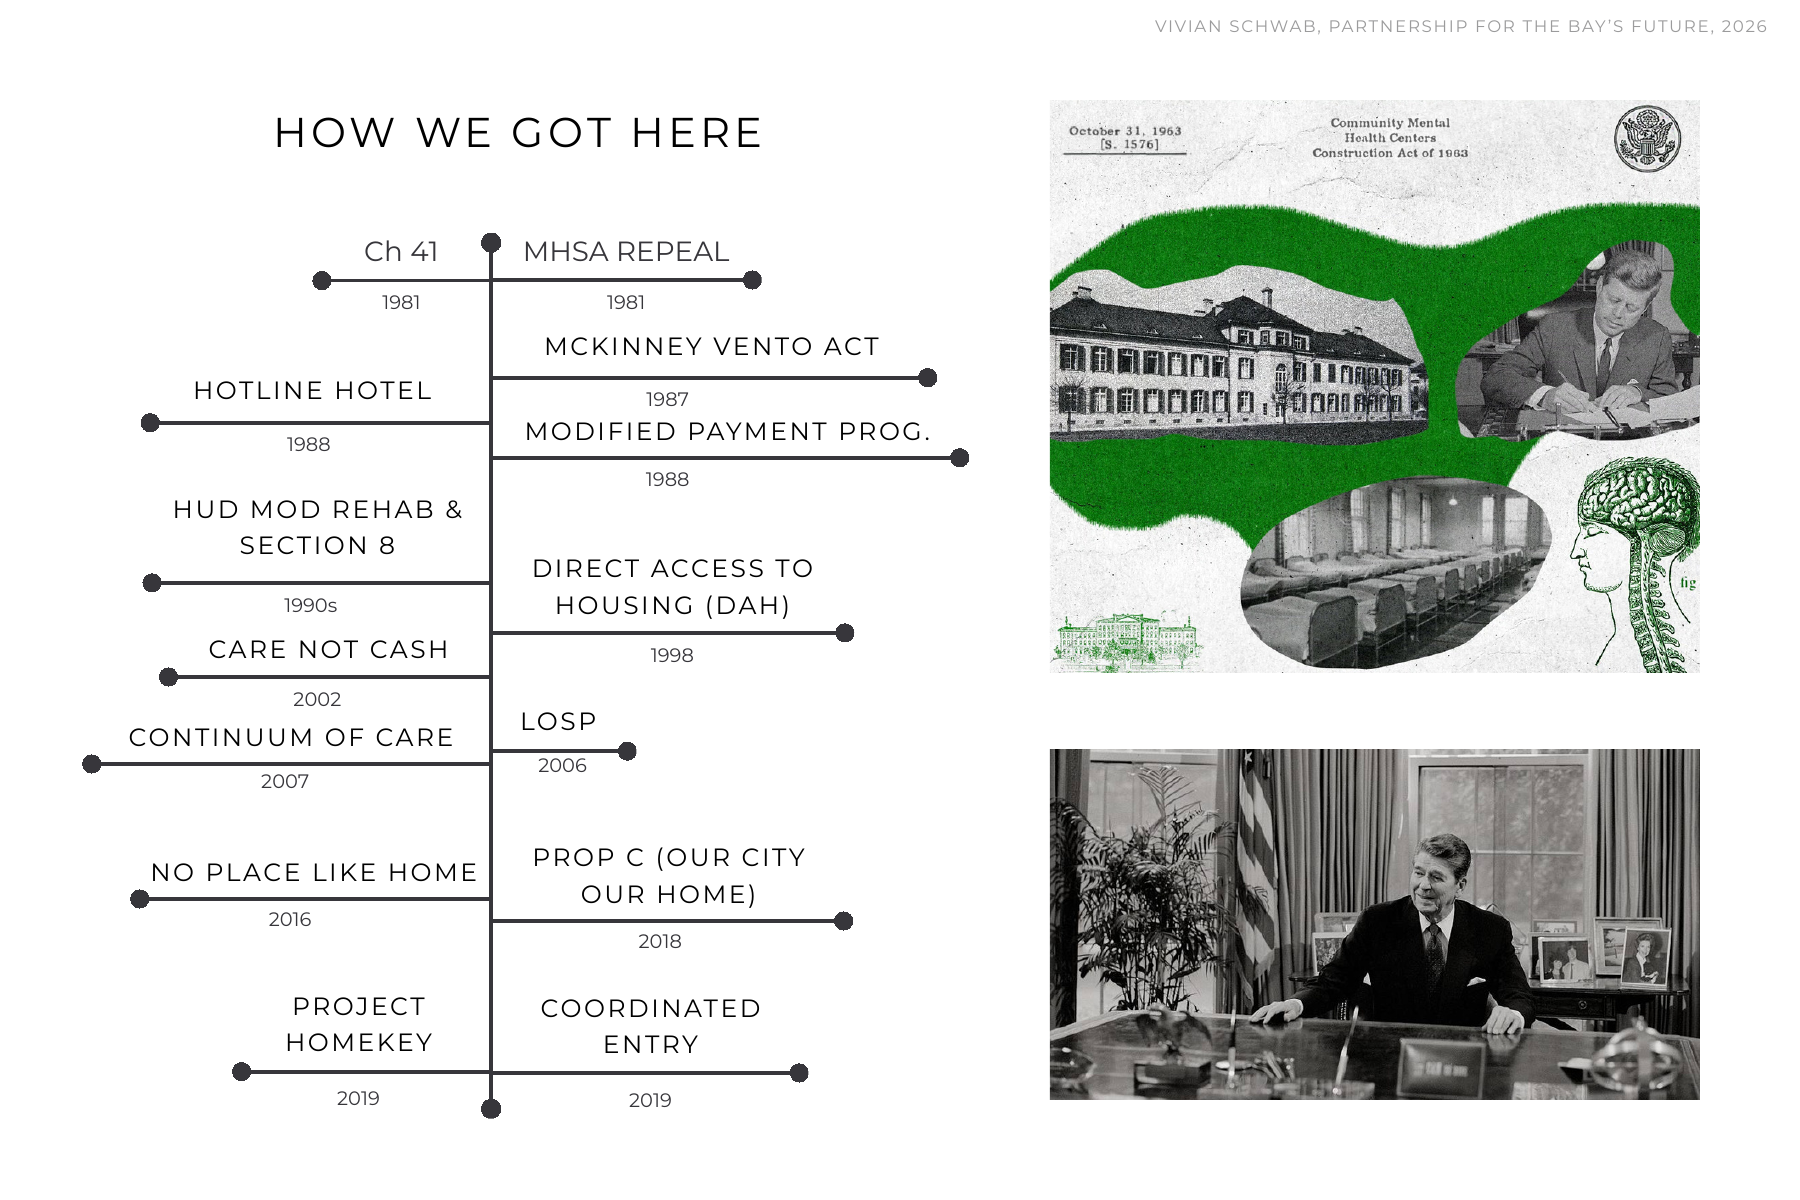
SROs in San Francisco date to the late 1800s. Over 95% of those that remain were built between 1906 and 1930, originally as market-rate workforce housing for longshoremen, sailors, working women, and immigrants. By the 1970s they were being rapidly demolished and converted, which prompted the activism that led to Chapter 41 of the San Francisco Administrative Code, the Hotel Conversion and Demolition Ordinance. In 1981 it set a regulatory baseline of about 20,000 units across 500 buildings.
Congress then defunded the community mental health infrastructure that was supposed to receive patients discharged from state psychiatric hospitals, and SROs absorbed them by default. A series of federal, state, and local programs formalized that role, and in 2019 Coordinated Entry began prioritizing the highest-acuity residents for permanent supportive housing.
The throughline: these policies scaled housing acquisitions significantly, while clinical and behavioral health capacity never caught up. That gap is where most of the friction in the system lives today.
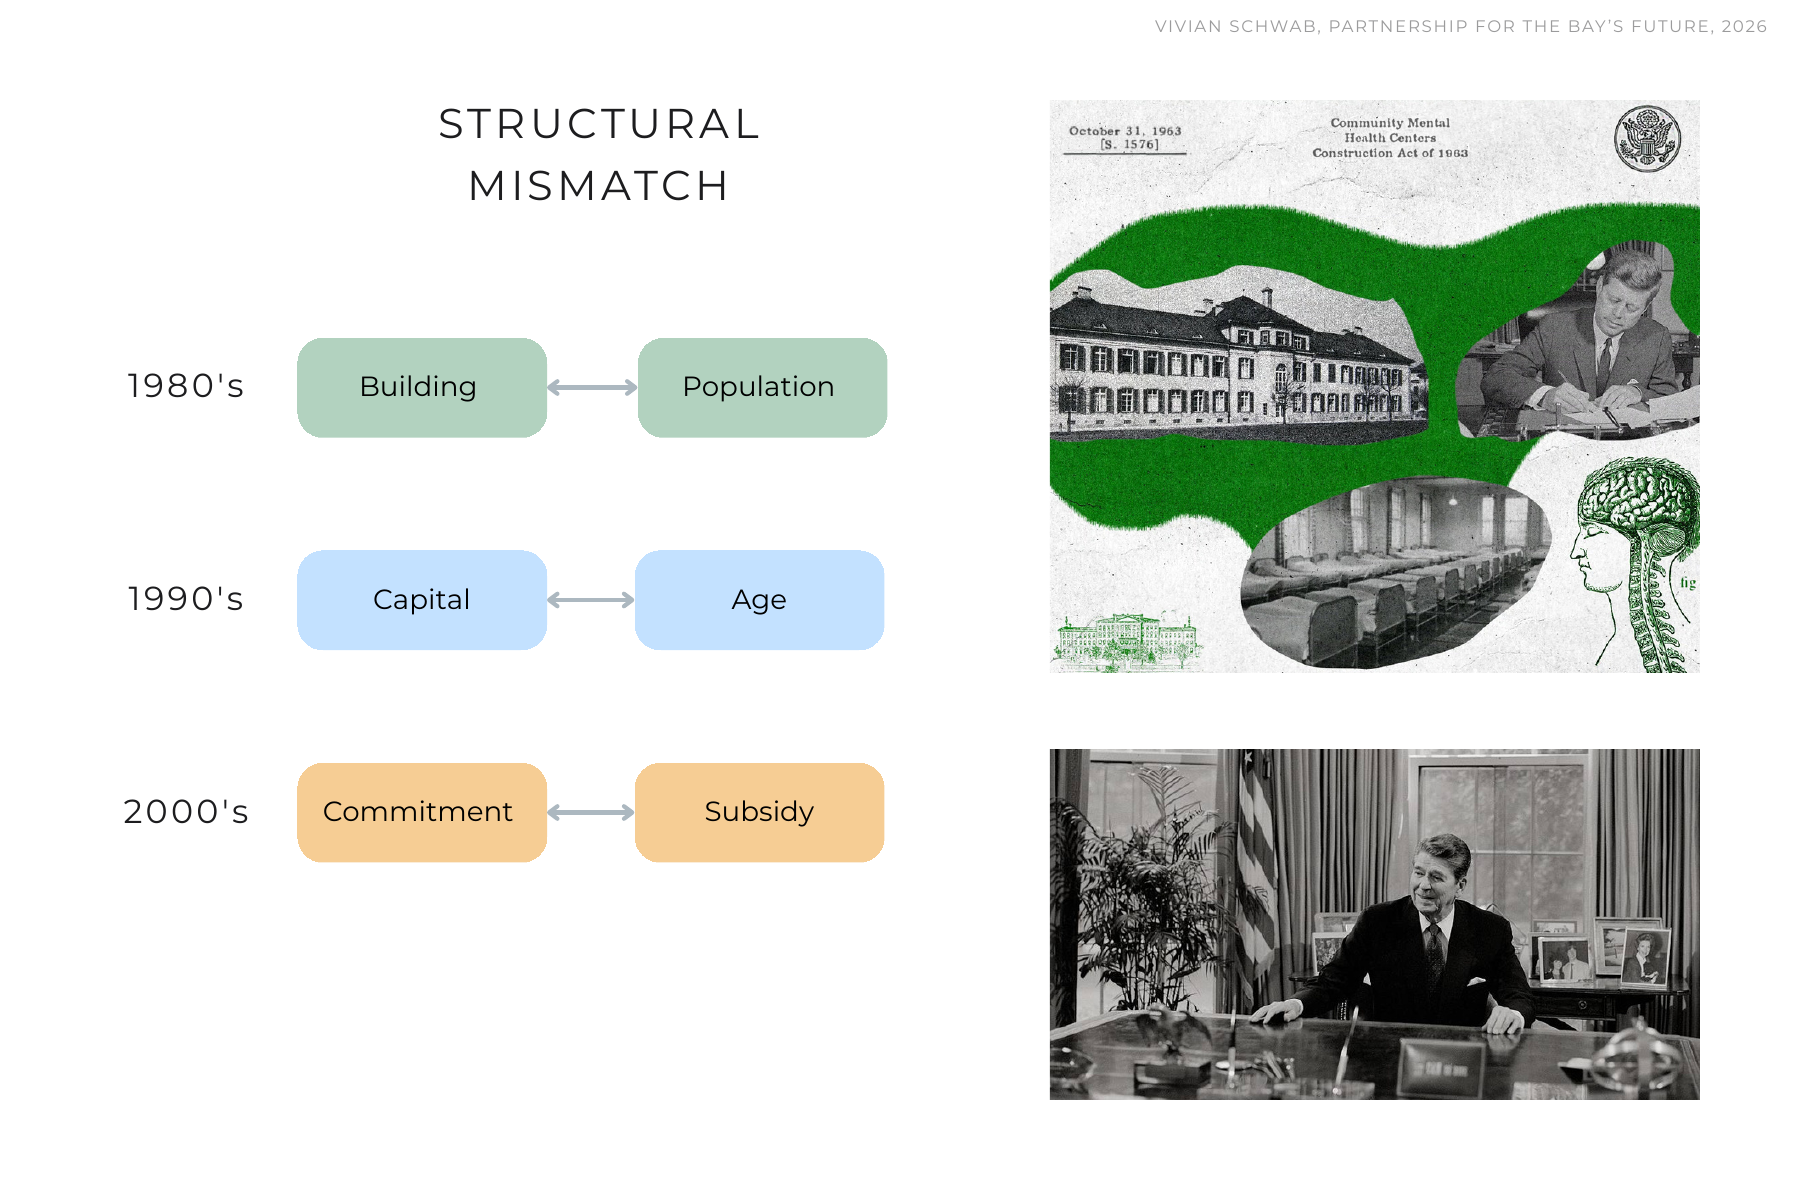
Building and population. Buildings designed for transient, young, single workers now provide permanent housing for a population dominated by older adults aging in place, people with serious mental illness, permanent disability, and substance use disorders.
Capital investment and building age. The nonprofit acquisition wave of the 1980s and 1990s put public capital into buildings that were already 75 to 85 years old. The financing was enough to transfer ownership and establish affordability covenants, but not to address the deferred maintenance already in the physical fabric. It was never designed to support recurring major rehabilitation.
Commitment duration and subsidy duration. Since the late 1990s, San Francisco has built its supportive housing system on a promise of permanent tenure. The money behind it was never permanent: annual appropriations, renewable federal grants, and fixed-term contracts written on cost assumptions that haven't held. As residents age in place and operating costs outpace subsidy increases, the gap widens.
Each mismatch began as a reasonable decision made at a fixed point in time. Each has outlasted its assumptions, and today we expect the building's financials, its services, and its community to absorb the difference, none of which were ever funded to do so.
This isn't only a San Francisco story. In Los Angeles, Skid Row Housing Trust spent years self-financing building-level operating deficits before it closed in 2023, and the public cost of the transfer and stabilization came to roughly $40 million. Across California, nonprofit owners in a statewide SRO preservation workgroup reported covering more than $24 million in operating deficits out of their own pockets.
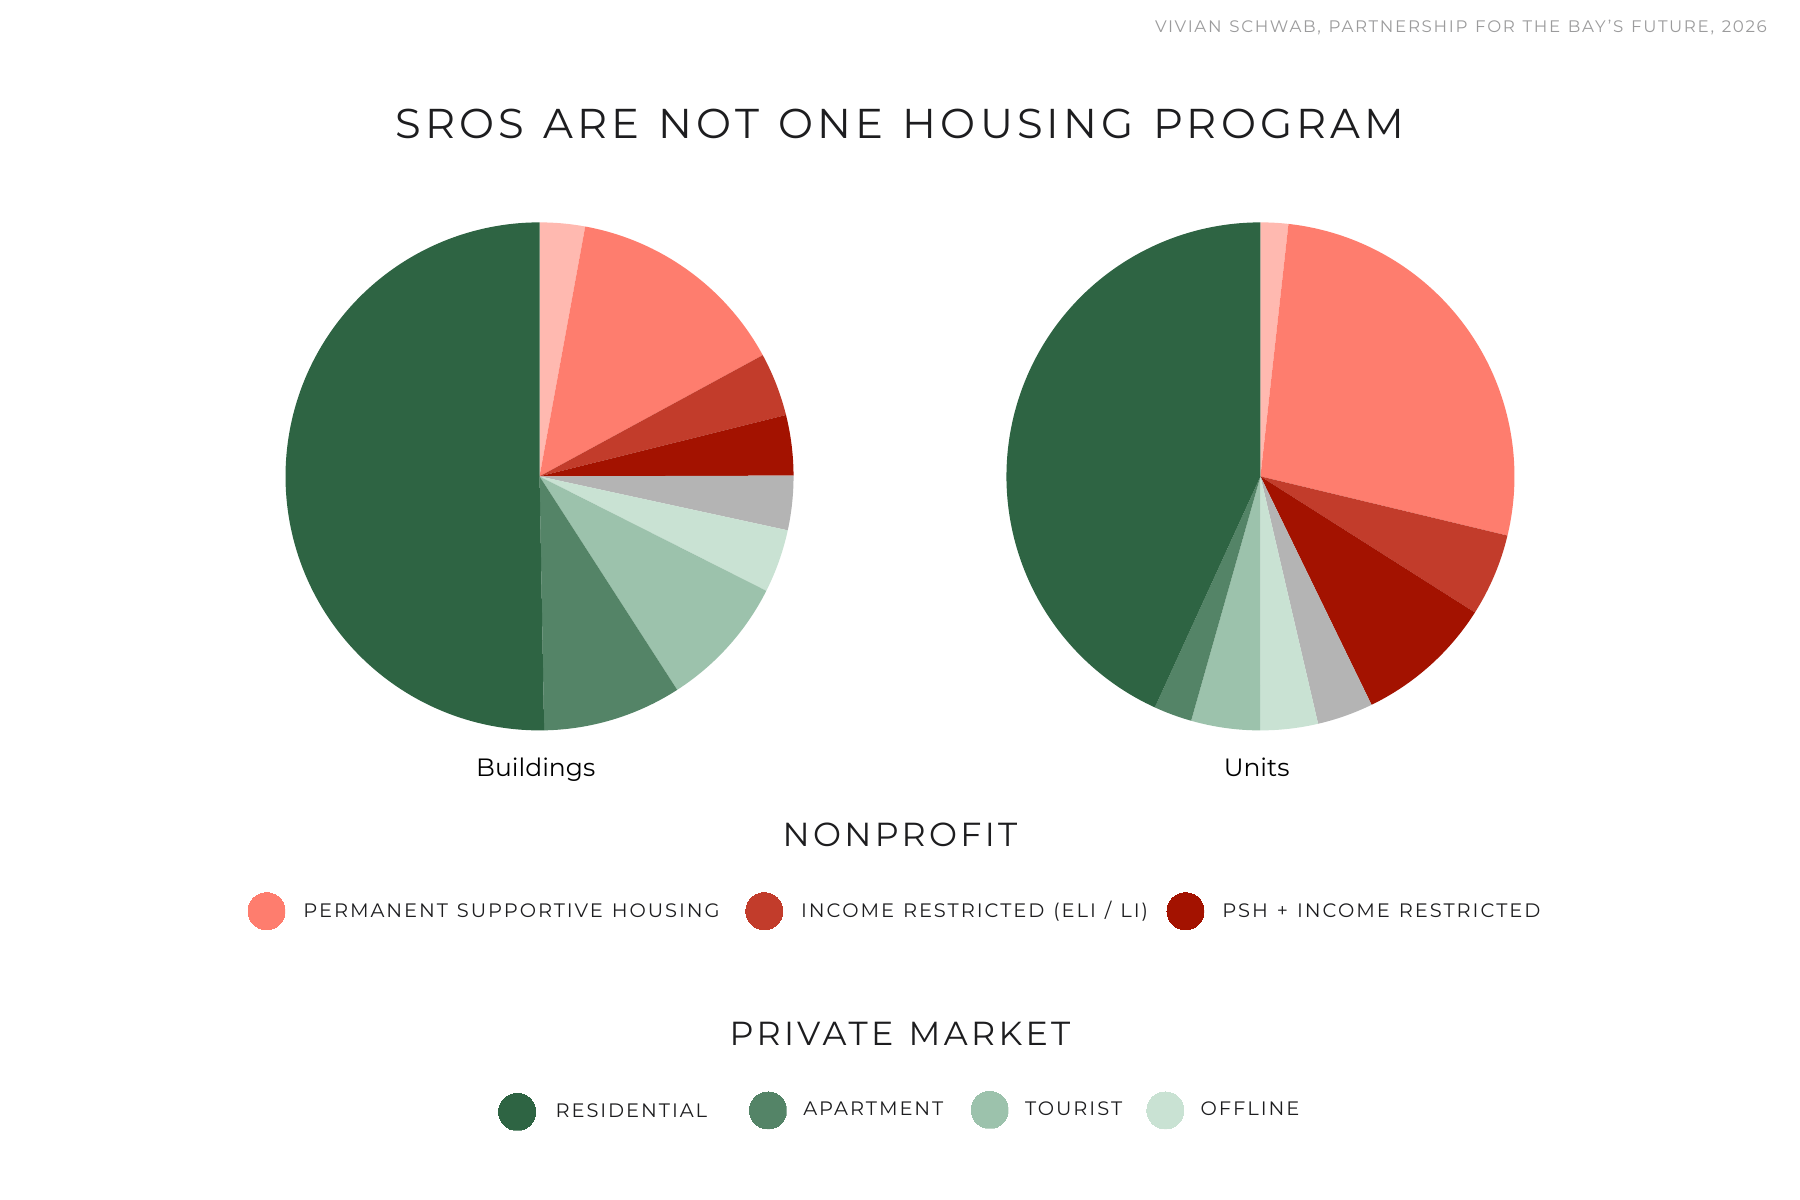
I've assembled one of the most complete SRO datasets for San Francisco to date, disaggregating roughly 515 buildings and 22,000 units by how the typology is being used and who it serves.
For this talk the focus is the publicly funded SROs: about 8,000 units in 100 buildings. Some operate as permanent supportive housing, with services attached. Some are income-restricted low-income and extremely-low-income buildings with no services attached. And some are "mixed," with both kinds of units under one roof. Keep track of that last group.
About 60 of these buildings are nonprofit owned and 40 are master leased from private owners. The analysis that follows looks at buildings in the MOHCD portfolio, all of which are nonprofit owned.
Financials
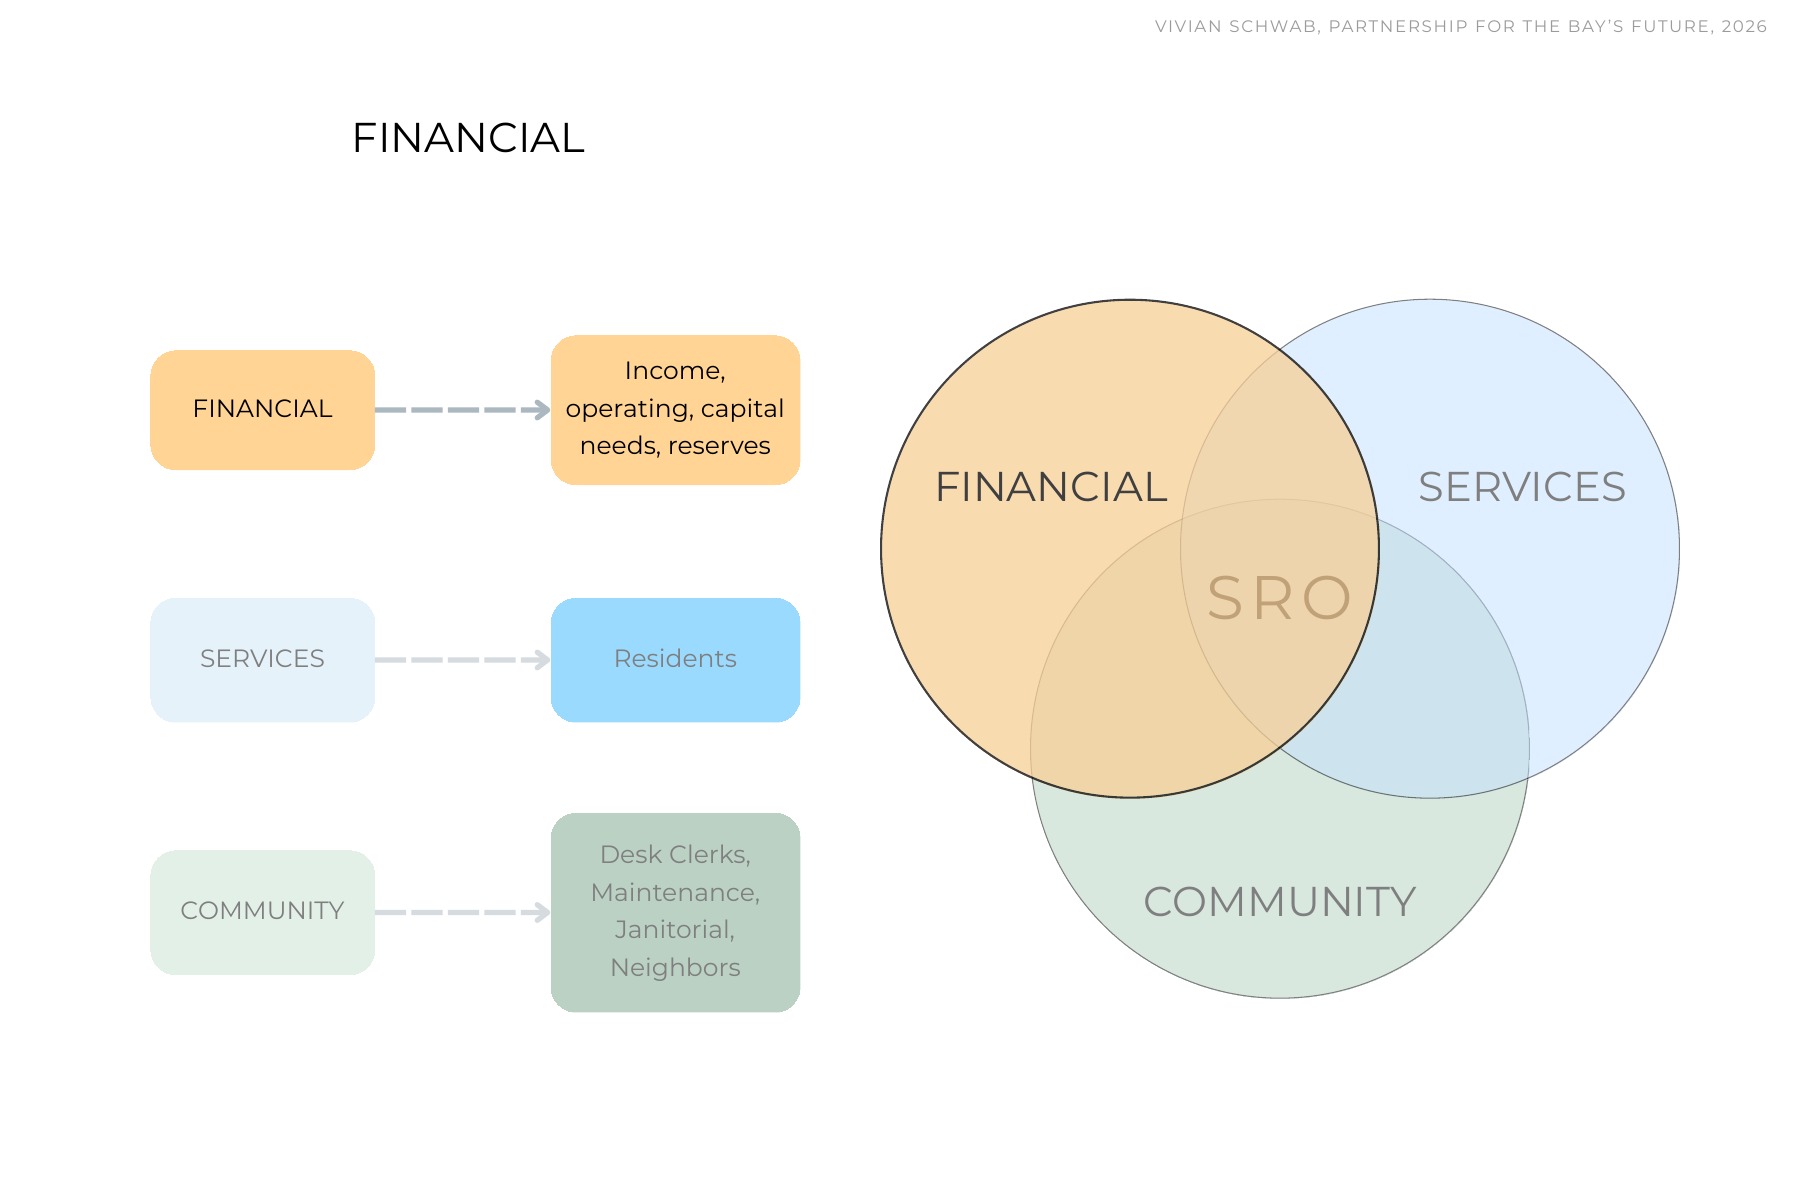
By financials I mean more than subsidy. I mean the whole balance sheet: what the building collects in rent and subsidy, what it spends to operate and service its debt, the reserves it holds, and the capital that comes in, or doesn't, when a major repair is needed.
The question is whether what's coming in covers what goes out, and whether we're putting in what's required to truly maintain these buildings. I look at it four ways: across the portfolio, by subsidy type, by building program, and inside one building over seven years.
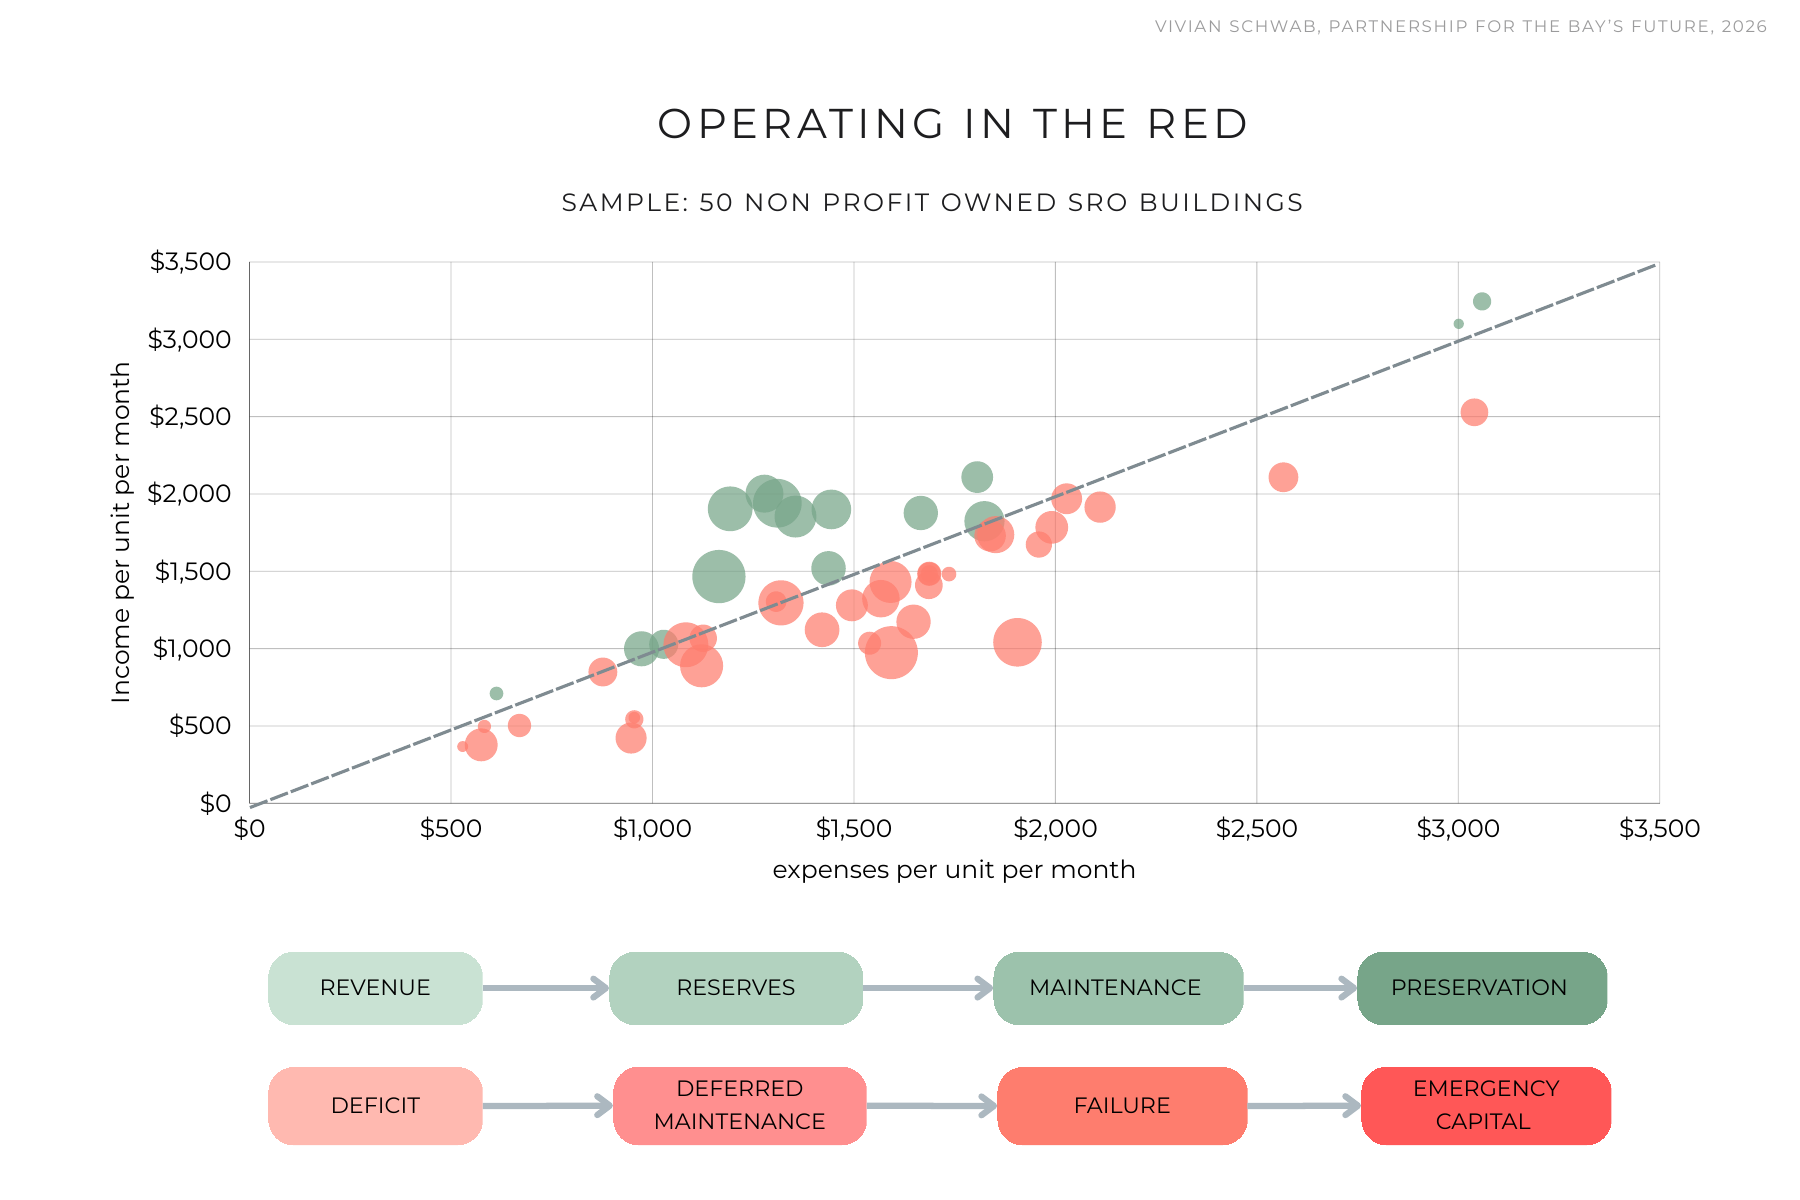
A sample of 50 of the 60 nonprofit-owned SRO buildings monitored by MOHCD through annual reporting. Each dot is a building, sized by its number of units. Operating expense runs along the horizontal axis and income up the vertical; the diagonal is break-even. Buildings above the line take in more than they spend. Buildings below it spend more than they bring in.
More than half of the buildings in this sample sit below the line. But not every building does: some break even, and some run a surplus.
Both directions compound. Revenue funds reserves, reserves fund maintenance, and maintenance is what preservation actually is. Meanwhile a deficit becomes deferred maintenance, deferred maintenance becomes failure, and failure becomes an emergency capital ask.
What separates the buildings above the line from the ones below it? Costs are diverging: wages, insurance, and maintenance are rising faster than income can follow. Insurance and casualty exposure matter too, since one fire or flood can move a building from break-even to deficit in a single year. So do vacancy and lease-up speed, and subsidy mix: LOSP sized to a building's gap versus more standardized subsidies, with roughly 1,200 lightly subsidized units portfolio-wide.
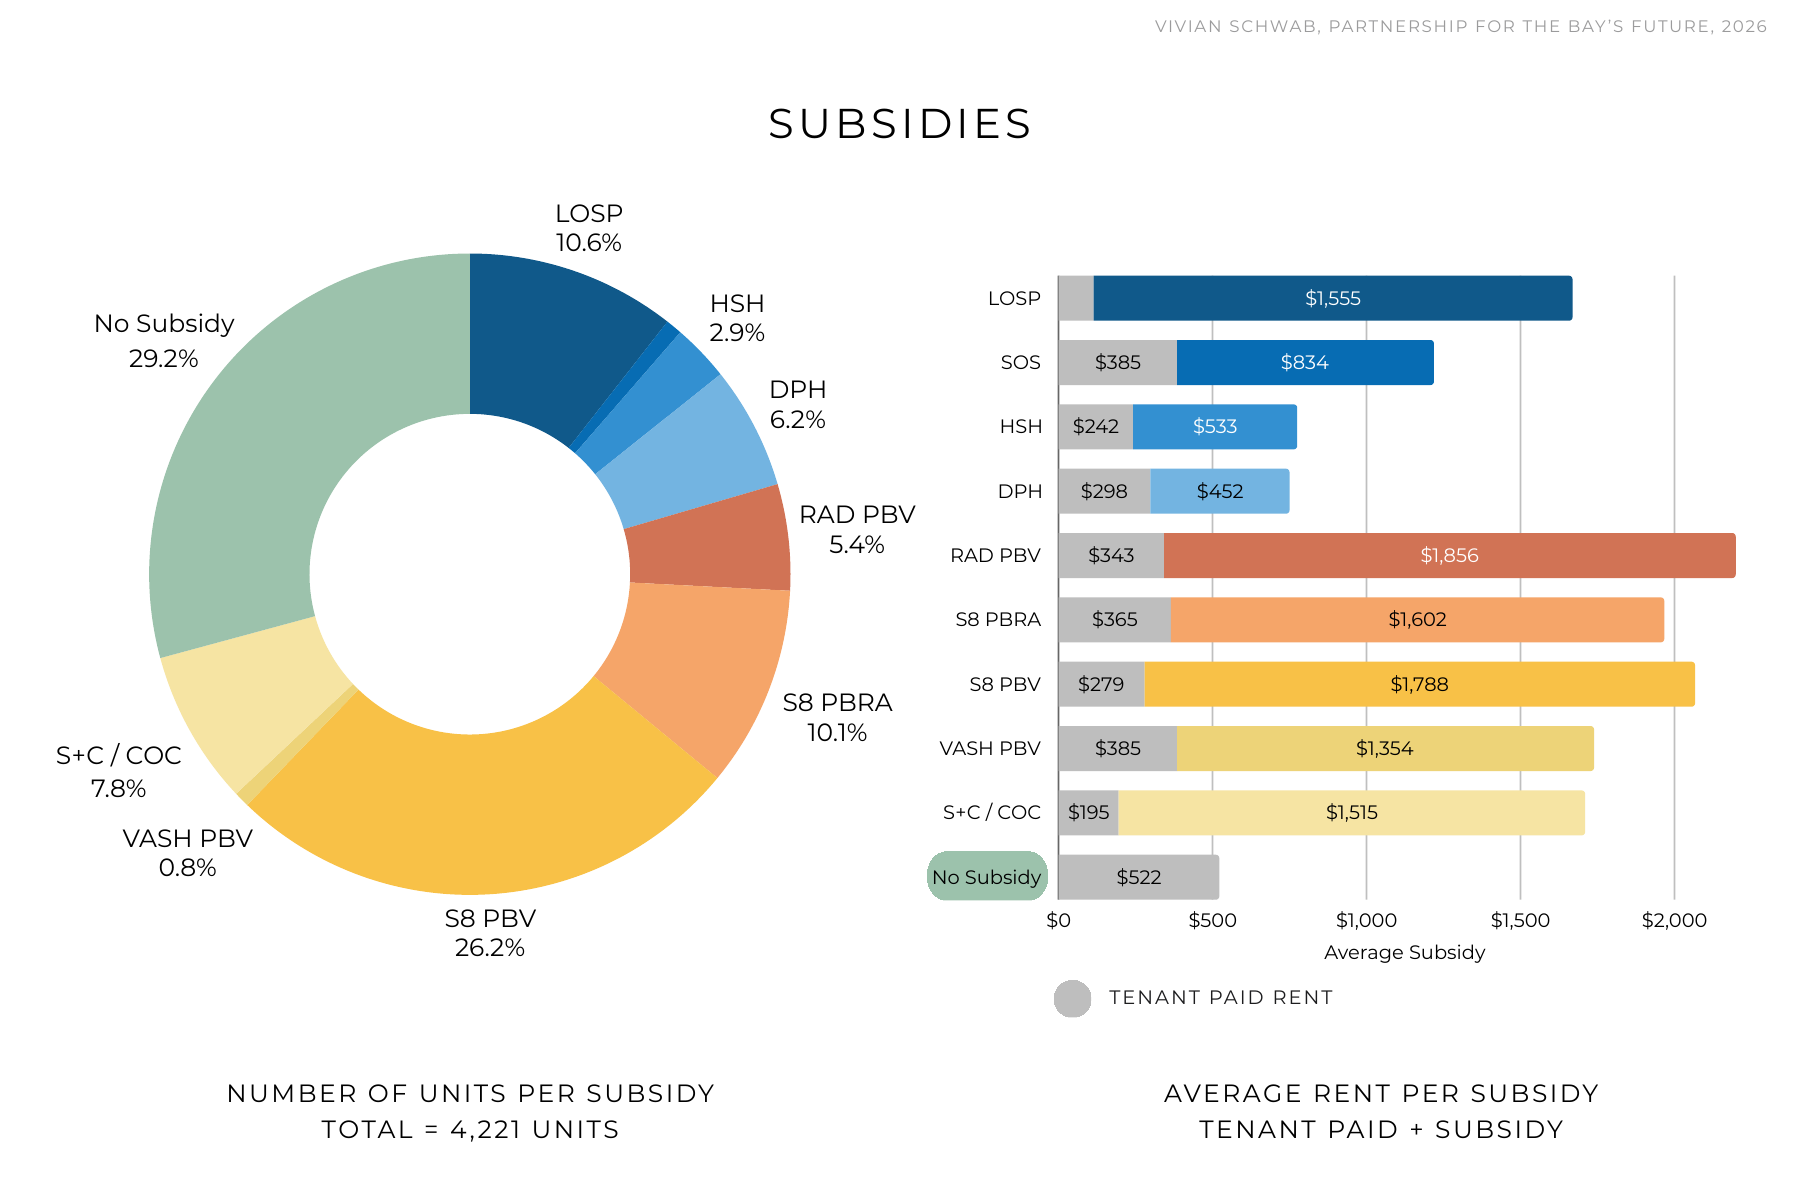
The same 50 buildings, roughly 4,200 units, broken out by subsidy type. On the right is the average rent associated with each subsidy; the gray portion is tenant-paid rent and the remainder is subsidy.
These are not interchangeable revenue streams. Some produce substantially more operating income than others. Roughly three in ten units in this sample have no ongoing rental subsidy at all, and those units bring in an average of $522 per month.
So these buildings face many of the same costs, including insurance, labor, utilities, repairs, and security, while operating with radically different revenue.
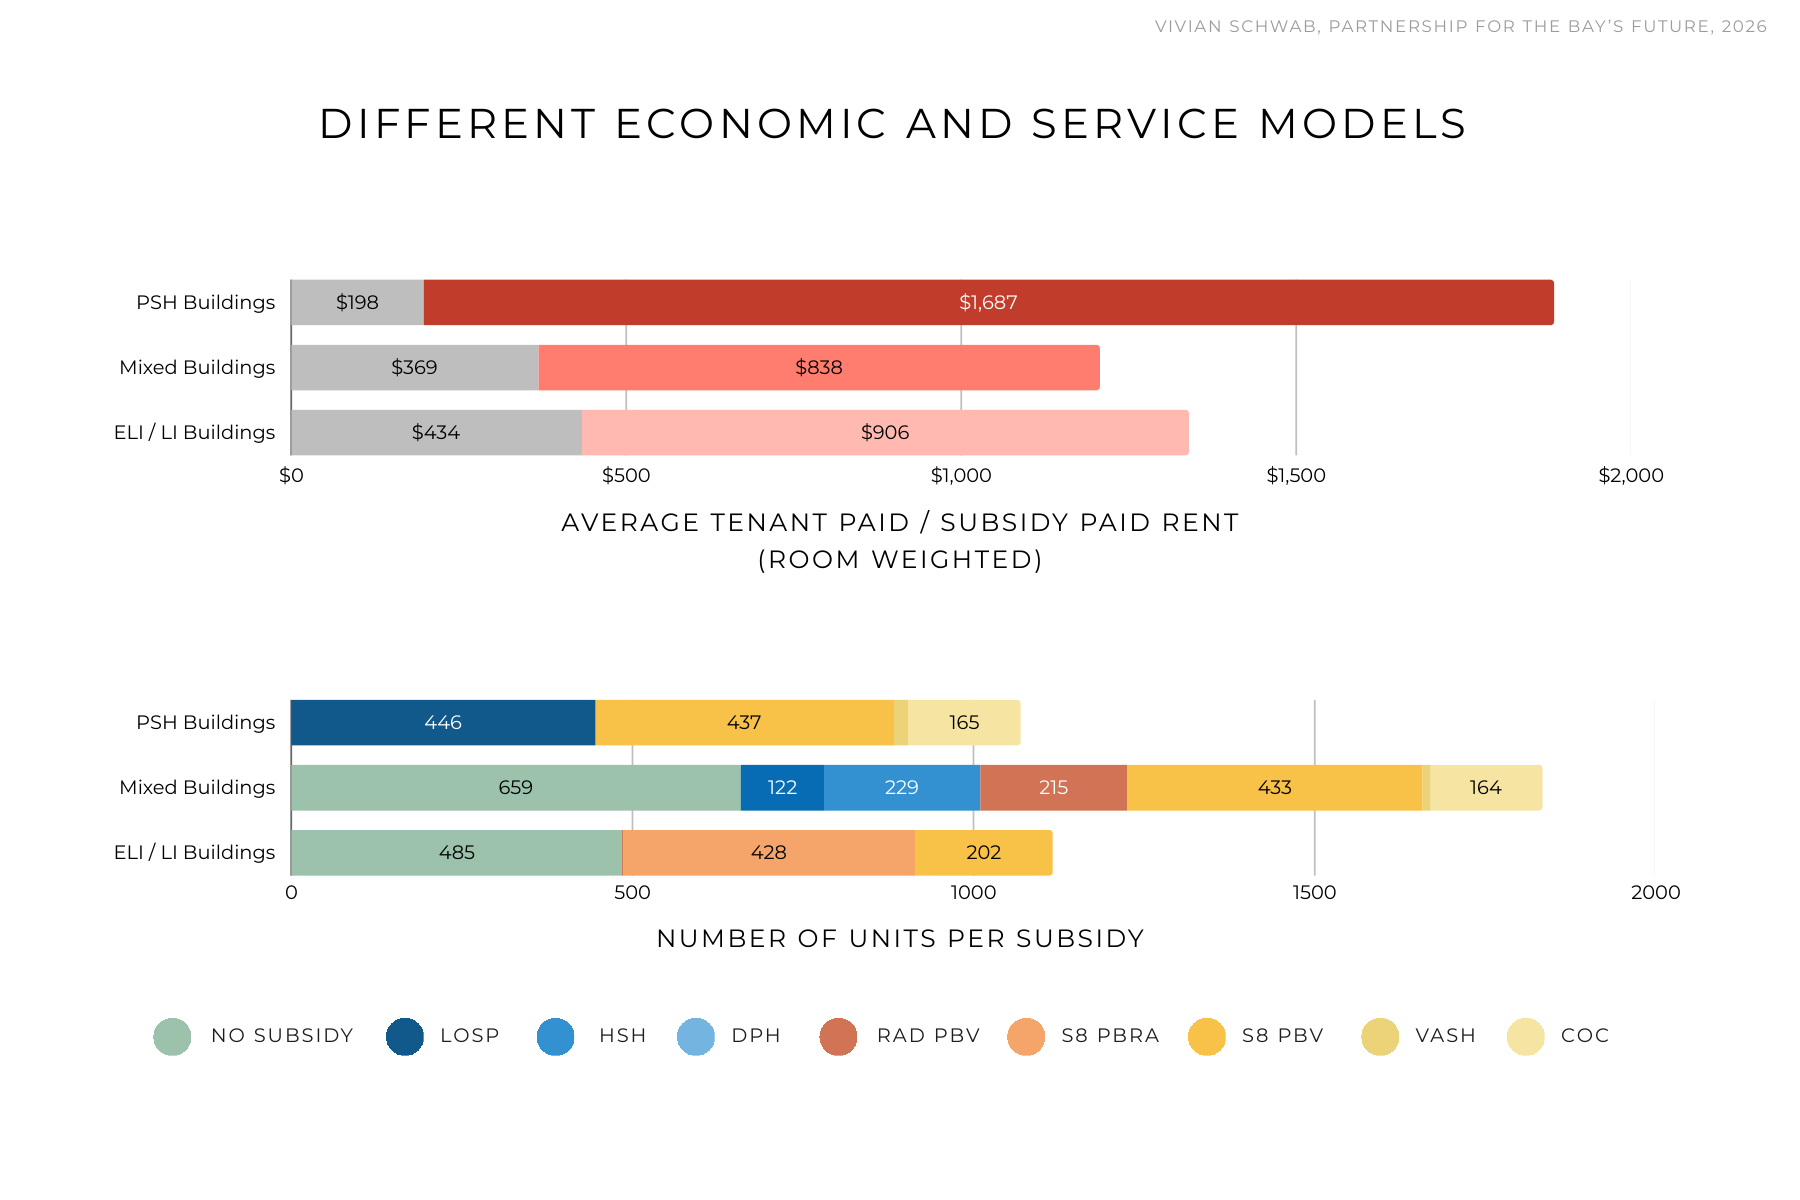
The same buildings by program type: 100% PSH, mixed buildings with PSH and income-restricted units, and 100% low- and extremely-low-income buildings.
Mixed buildings are particularly revealing. One unit may be PSH, with a subsidy and some level of supportive service attached. Next door, a unit may have neither. Its resident may pay a higher rent than their neighbor, but without a subsidy the unit brings in substantially less, and that resident may have no formally funded case-management support.
Both residents use the same hallway and elevator, the same maintenance staff and desk clerk, and often the same formal and informal support networks. This is one place where our funding categories and the lived reality of the building start to diverge.
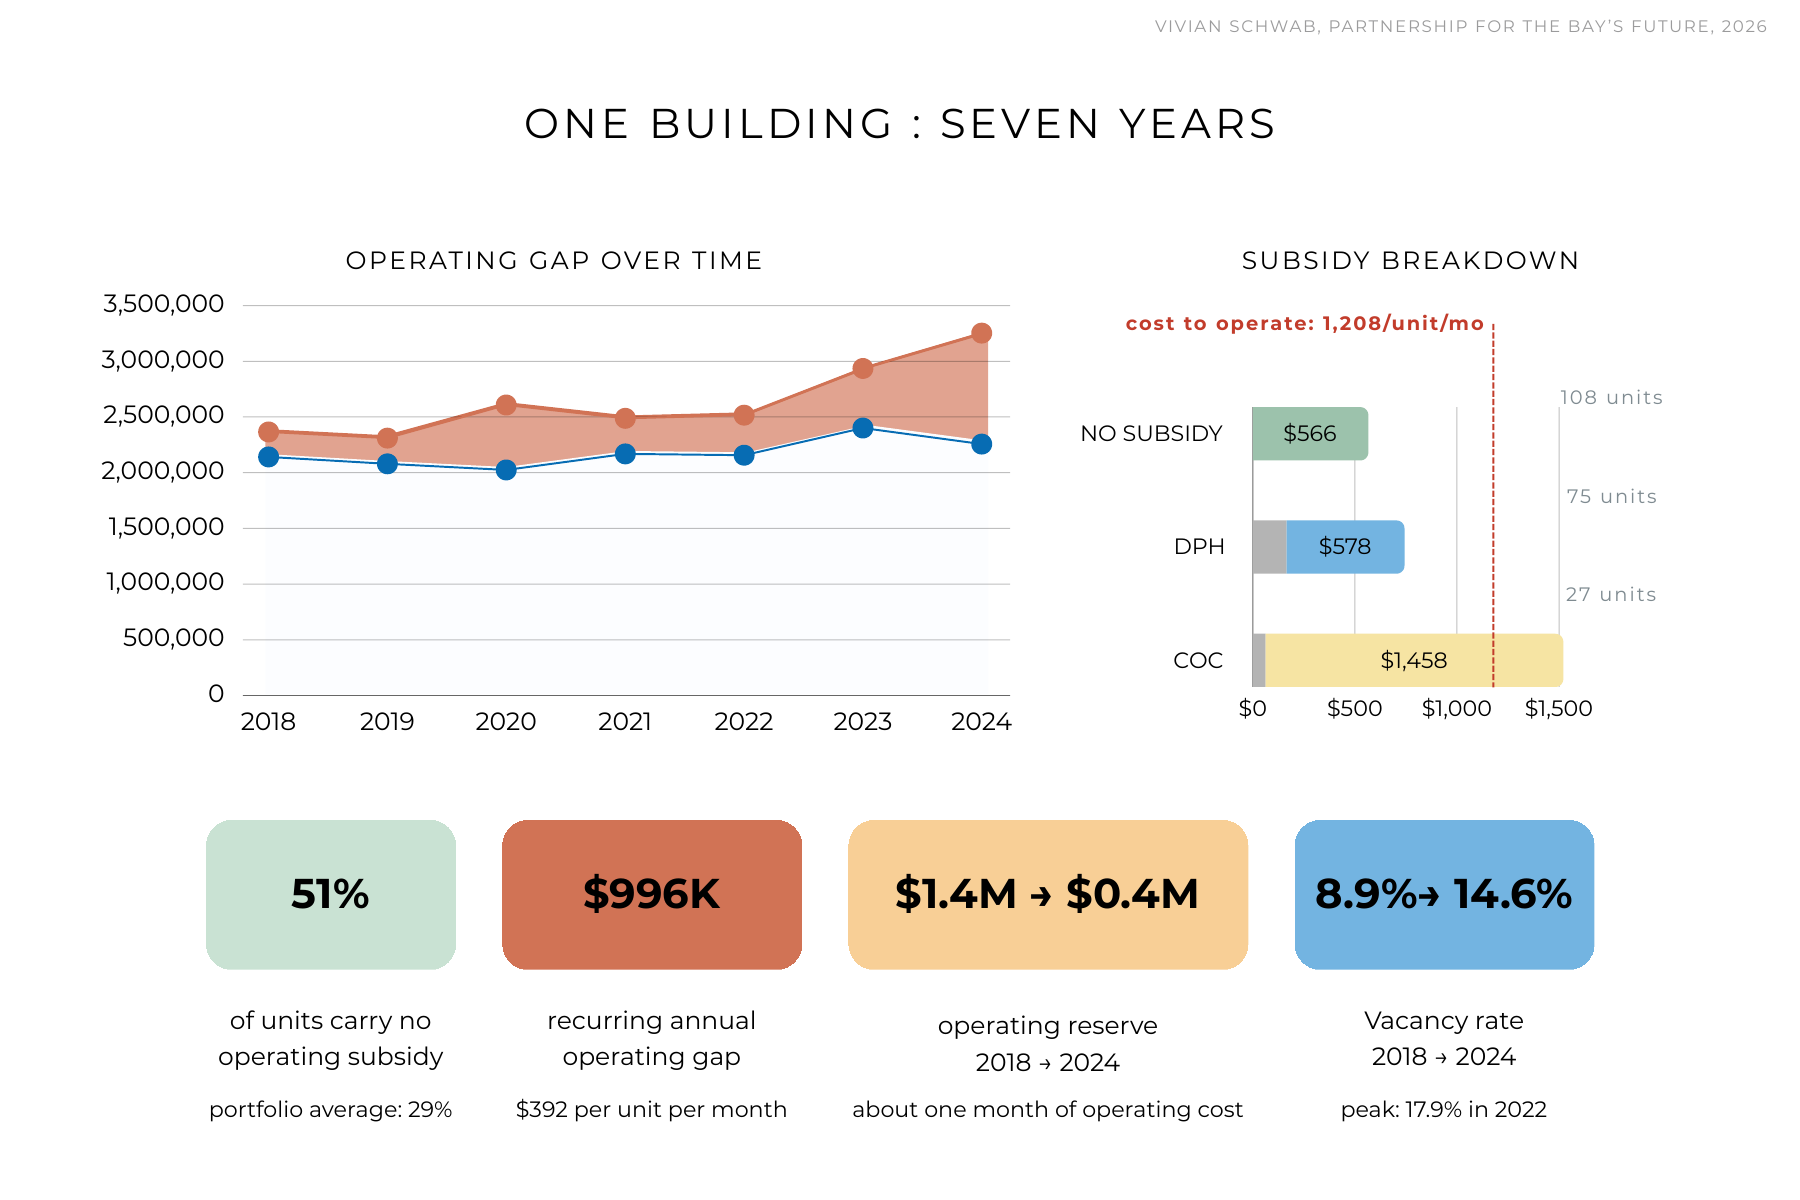
This is a particularly distressed building in the portfolio: a roughly 200-unit, nonprofit-owned SRO. About half the units carry a subsidy, and 51% don't. It's one of the dots on the scatter plot, and this is what that dot looks like over seven years.
The blue line is rent plus subsidy if every unit were occupied. The red line is what it costs to operate. They have not crossed once in seven years. In 2018, income covered about 90% of cost; by 2024, about 70%. That's an annual gap of about $996,000, or $392 per unit per month.
And that assumes full occupancy. Vacancy rose from 19 units (about 9%) in 2018 to 38 (nearly 18%) in 2022, and was 31 (about 15%) in 2024. In dollars, vacancy loss went from $118,000 to $302,000, peaking at $400,000 in 2023. That's a second loss stacked on the first.
On the right is what a unit in this building actually earns per month by subsidy type. The dashed line is what it costs to operate one, about $1,200, not including services. Unsubsidized units bring in $566. Units subsidized by DPH through Direct Access to Housing bring in an average of $578 in subsidy. Only the 27 CoC units, the Shelter Plus Care units, earn more than they cost. So when we say a building is "subsidized," we are describing a legal status, not an economic one.
Nor does this look like a management problem. The management fee has been identical for six straight years. The operator raised subsidy amounts where allowed, tried master leasing, and asked the City for additional CoC units but was told no. So the gap had to go somewhere. It went into the operating reserve, which fell from $1.4 million to under $400,000, about one month of operating cost.
That's the pattern: the cost never disappeared. It moved. Out of the subsidy, into the deficit, into the reserve, and when the reserves run dry, into the City.
What can you see from the annual monitoring report, and what would you like to see earlier? Income against operating expense, reserve balances, and year-end vacancy are visible today, but they are backward-looking and about a year behind. Harder to see is how fast the operating reserve is being drawn down, how long units sit vacant, and rising bad-debt and eviction legal-cost requests. Services data, staffing vacancies, and physical condition sit in other agencies. Early warnings would include an operating reserve falling while the replacement reserve holds, rising turnaround days, more code violations, and repeat requests to MOHCD.
What does the reserve drawdown look like from the owner's side? The reserve is a shock absorber: it buys time, not a fix, and every year of drawdown shortens the runway. Deferred maintenance is the first thing cut when the math doesn't work. CCDC's own figures are about $490 per unit per month in revenue against about $521 in cost, which leaves no room to add staff.
How would a subsidy for the unsubsidized units need to be designed to be reliable long term? Around 60% AMI is a healthier operating benchmark than ELI rents alone, and required reserve funding needs to be part of operating budgets. Unsubsidized units are roughly a quarter of the MOHCD portfolio, and CCDC is disproportionately exposed. The model to look at is a subsidy sized to a building's need, the way LOSP is.
What would it take to change a building's trajectory rather than just delay it? Delay is one-time infusions and reserve top-ups; change is recurring revenue matched to recurring cost. The operating fix should be paired with recapitalization so the building isn't also carrying deferred capital needs. Recent CCDC wins include Swiss American Hotel (funded after a failed attempt about eight years ago), Clayton (funded for rehab), and Sinclair (half SRO, half studios, completed).
Services
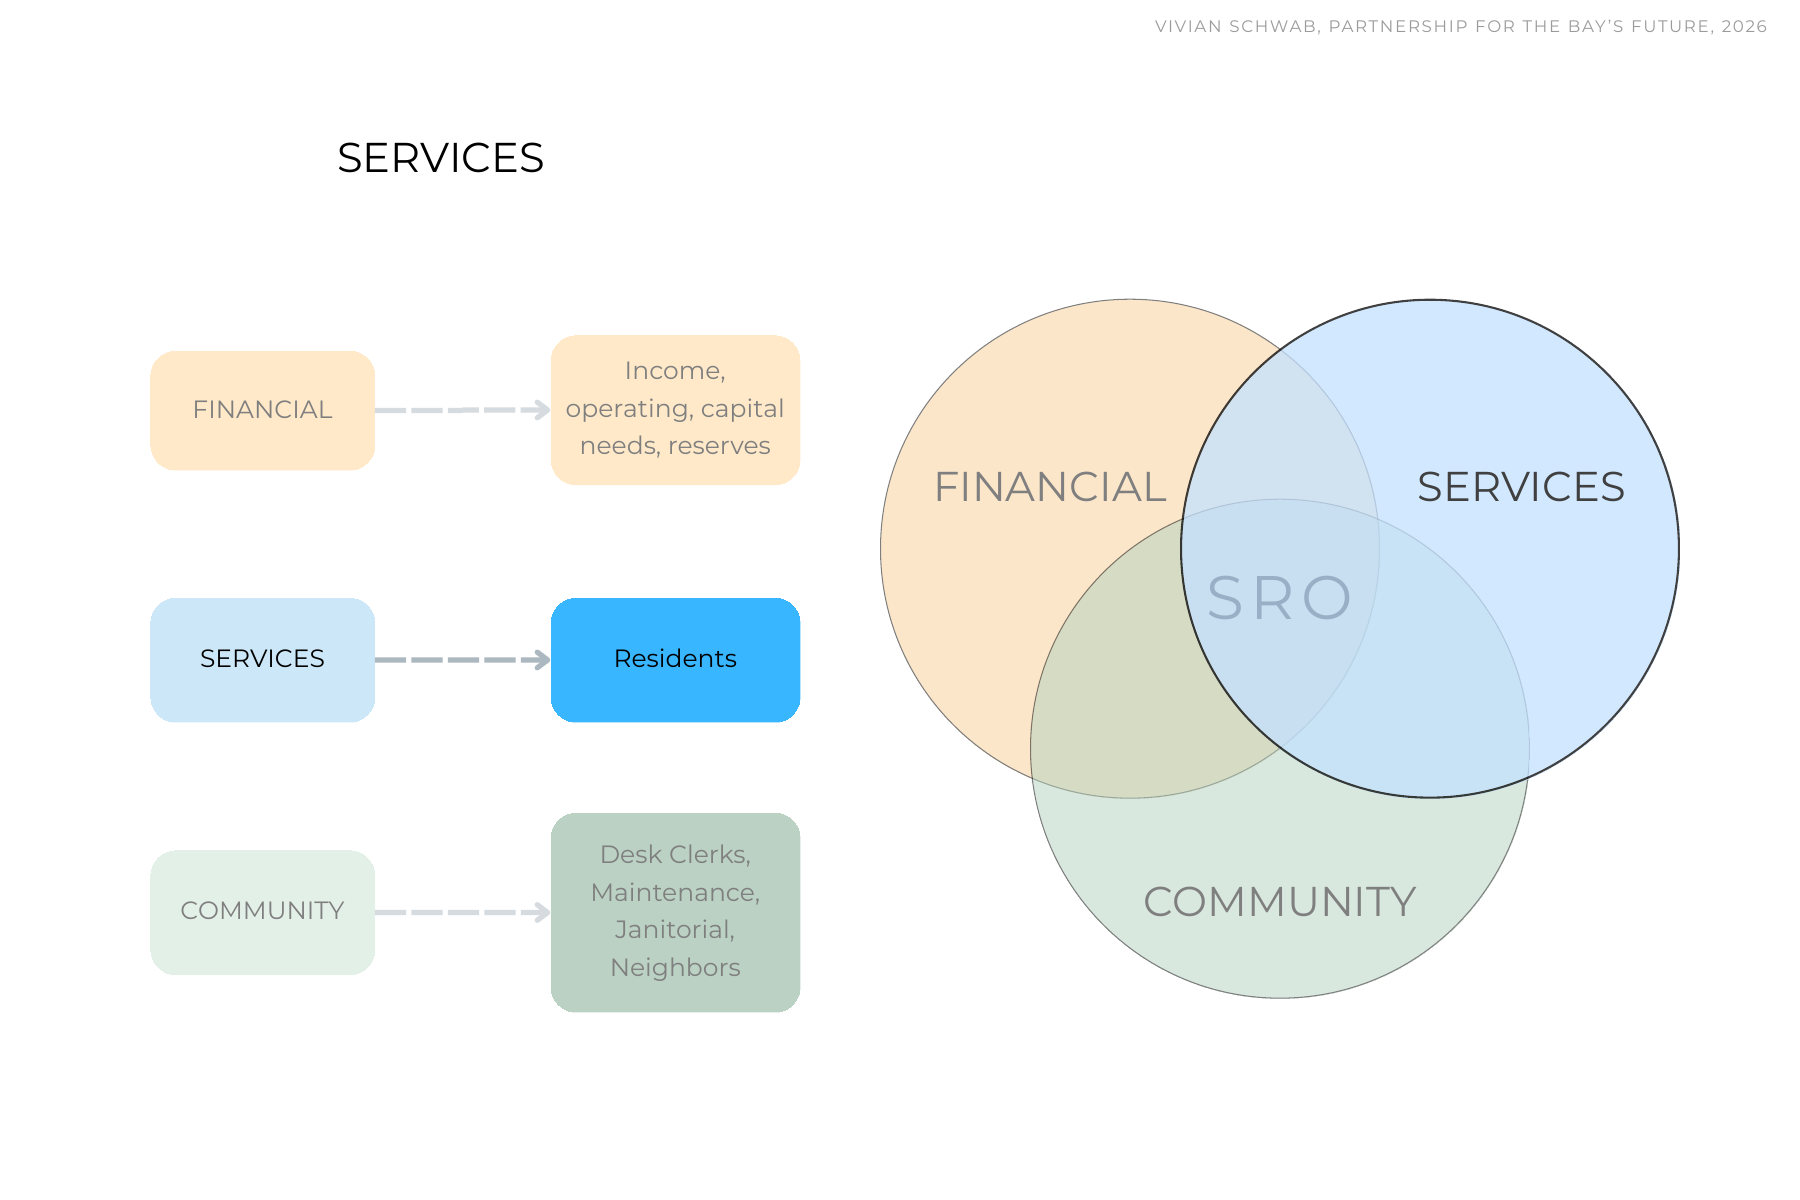
The second system is the "supportive" in permanent supportive housing: everything between a person's assessment and their stability once housed. How they're matched to a building, the case management on site, and the connections to health care, behavioral health, and benefits.
The question is whether the people placed in these buildings get the support they need to be stable and remain housed, and when they don't, where that need goes.
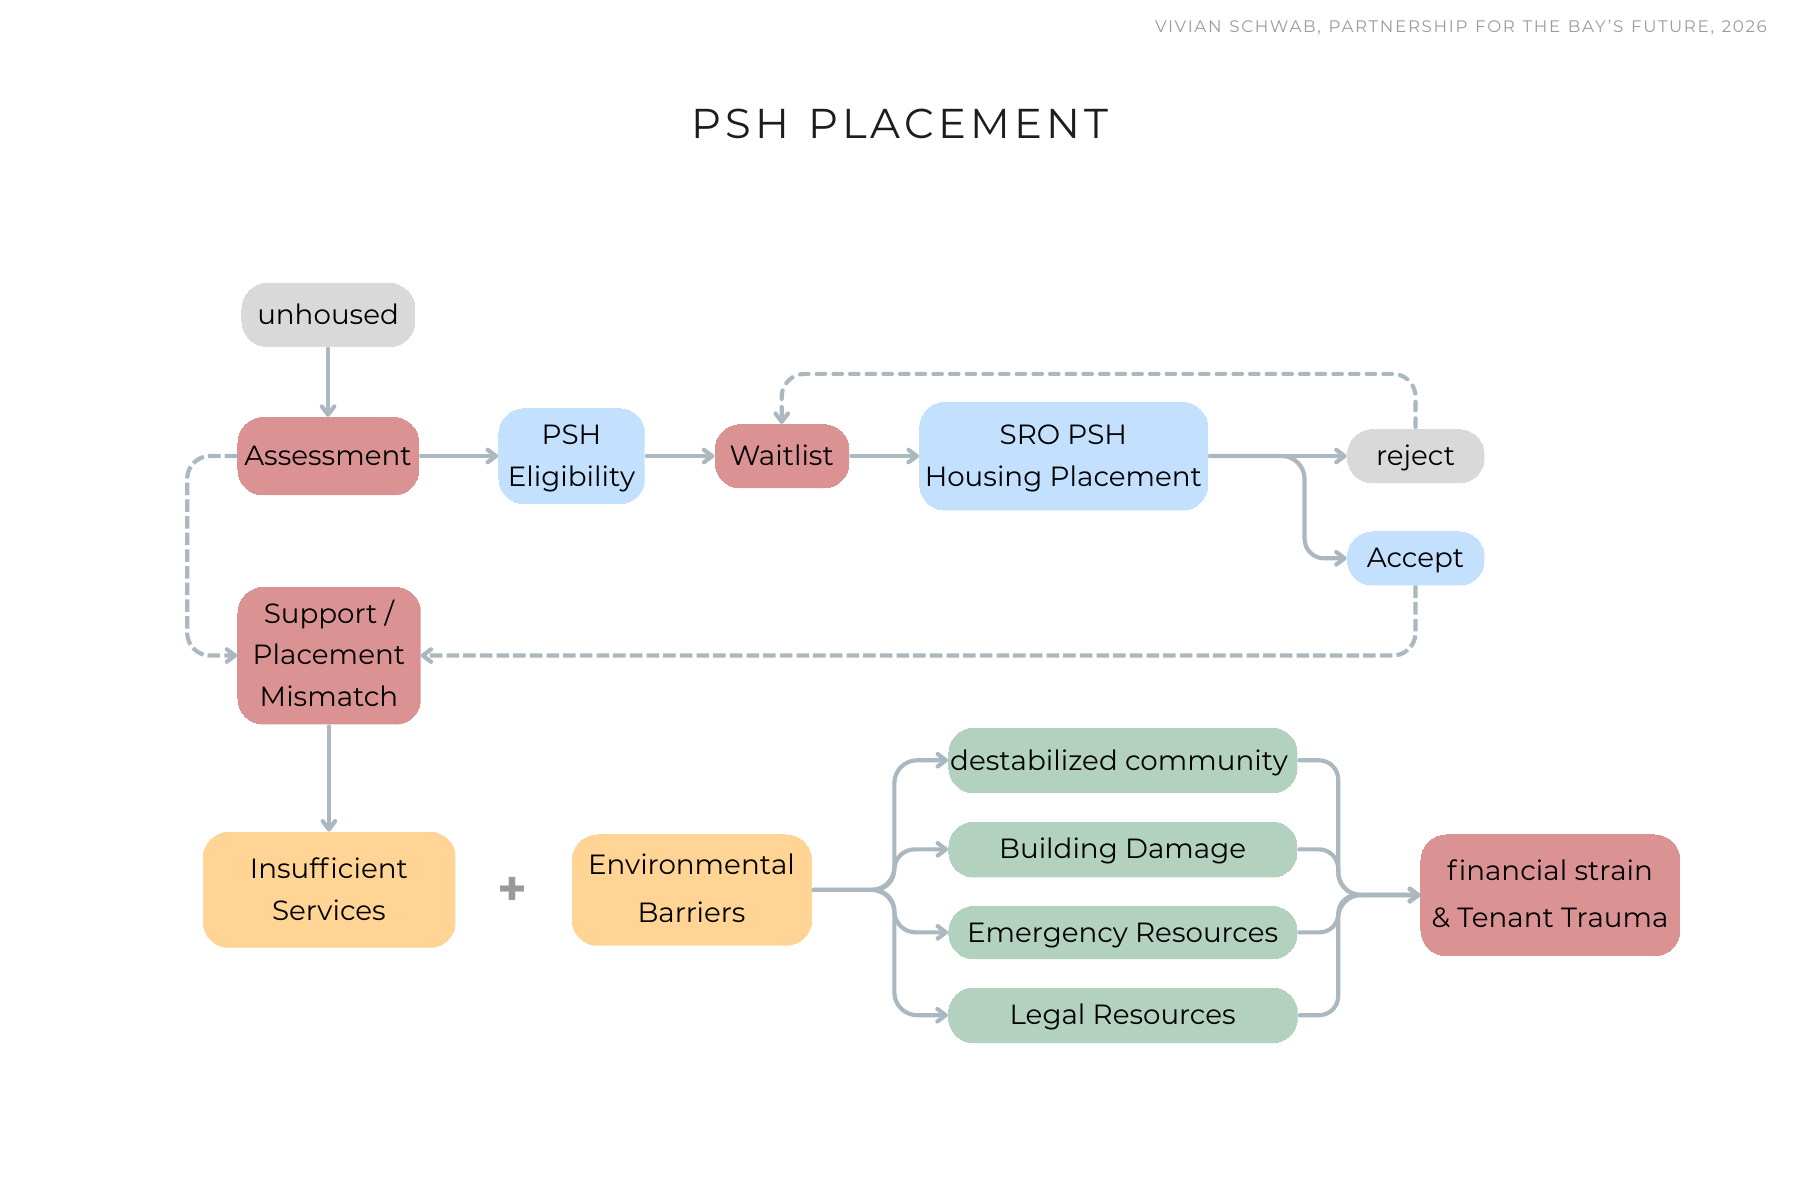
An individual enters through an assessment. If scored as high acuity, they're referred to PSH and added to a waitlist. When a unit comes online and they're at the top of the list, they're placed, and they can accept or reject the unit.
If there is a mismatch between the client, the support services they're given, and the building they're placed into, we drop into the bottom half of the cycle. The resident's needs exceed what on-site case management can provide. Unmet needs show up in the building as fires, floods, sanitation issues, and conflict with neighbors. Property management absorbs the consequences, staff burn out and turn over, emergency resources are deployed, and often the eviction cycle begins.
From there a resident is on one of two paths. If the services side works as intended, it can lead to more intensive case management. If that fails or lags, it falls to property management, which leans on a lease violation, a notice, and eventually eviction. Which path someone takes depends on alignment within a fragile and overburdened system.
The cost implications reach the portfolio: operating costs absorb the staffing strain, capital condition degrades from damage, vacancy compresses revenue, and subsidy levels don't flex to compensate.
So where does someone go when their needs exceed what the building can provide? PSH is supposed to sit in the middle of a continuum. Below it, for lower need, is recuperative care. Above it, for higher need, is residential board and care or a locked facility. In practice both ends are thin. Recuperative care has no dedicated funding stream and nowhere affordable to land afterward, and higher-need residential beds are scarce because board and care is deemed too expensive to invest in. When the tiers around PSH are missing, PSH becomes the default for needs it wasn't designed to meet, and the building absorbs the difference.
Vivian Schwab: First, I'd like to ask you to explain the term acuity. I've used it a lot so far in this presentation. Can you explain what that means, and how it relates to PSH success?
Peter McElroy: It depends who you ask. One way to think about acuity is the risk of an adverse outcome. Another is medical utilization. A third is how much someone struggles to stabilize, or whether they pose a threat to property or to other people. Those are not the same thing. We have clients who are sick but live full and harmonious lives. Sometimes the level of care they need increases with age, but stepping up the service level means an in-home health aide, or roving services provided by our Department of Public Health. It doesn't need to mean a change of location.
Vivian Schwab: Bearing that in mind, what have you seen to be effective in getting people to the right placement, with the right supports in place?
Peter McElroy: Housing providers should be clear with Coordinated Entry about what they see as the failures, and the leading indicators of those failures. Criminal background does not predict lease violations. But prior history in PSH housing matters: we should ask what didn't work the first time. And there should be a protocol for case conferencing.
Vivian Schwab: When a placement isn't working, what options exist today short of eviction, such as a transfer or a higher level of care, and how often can they be used?
Peter McElroy: Housing First works, but the first housing doesn't always work, and when it doesn't, that requires a shift in perspective and approach. We picked ten clients who had been locked out and asked what it would take to get them safely housed again. The first question is what went wrong. The relationship had deteriorated, and, for example, the service staff can become the object of distrust for a client suffering from paranoid delusions. A transfer, before things go south and with the right supports in place, can help. But in other cases we need to address the underlying pathology. So we brought together the care team and asked what conditions would need to be in place for this client to remain stably housed. For example, after six months they've demonstrated a period of stability in non-congregate shelter, they're on stabilizing meds, and they're ready for placement. So the answer has two parts: being very clear about the necessary conditions for housing stability, and care coordination to get there.
Vivian Schwab: On services, what would it take to make a clinical layer standard in supportive housing, and to give residents who stabilize somewhere to go next?
Peter McElroy: We need connections that allow for a rapid, compassionate clinical intervention as part of the response to disruptive behavior. We need more step-down options. And we need adequate skilled nursing facility (SNF) placements.
Vivian Schwab: Given the resources we see available today, what is one intervention that you'd like to see become routine rather than exceptional?
Peter McElroy: Expanded housing needs assessment and care coordination for every client going into PSH.
Community
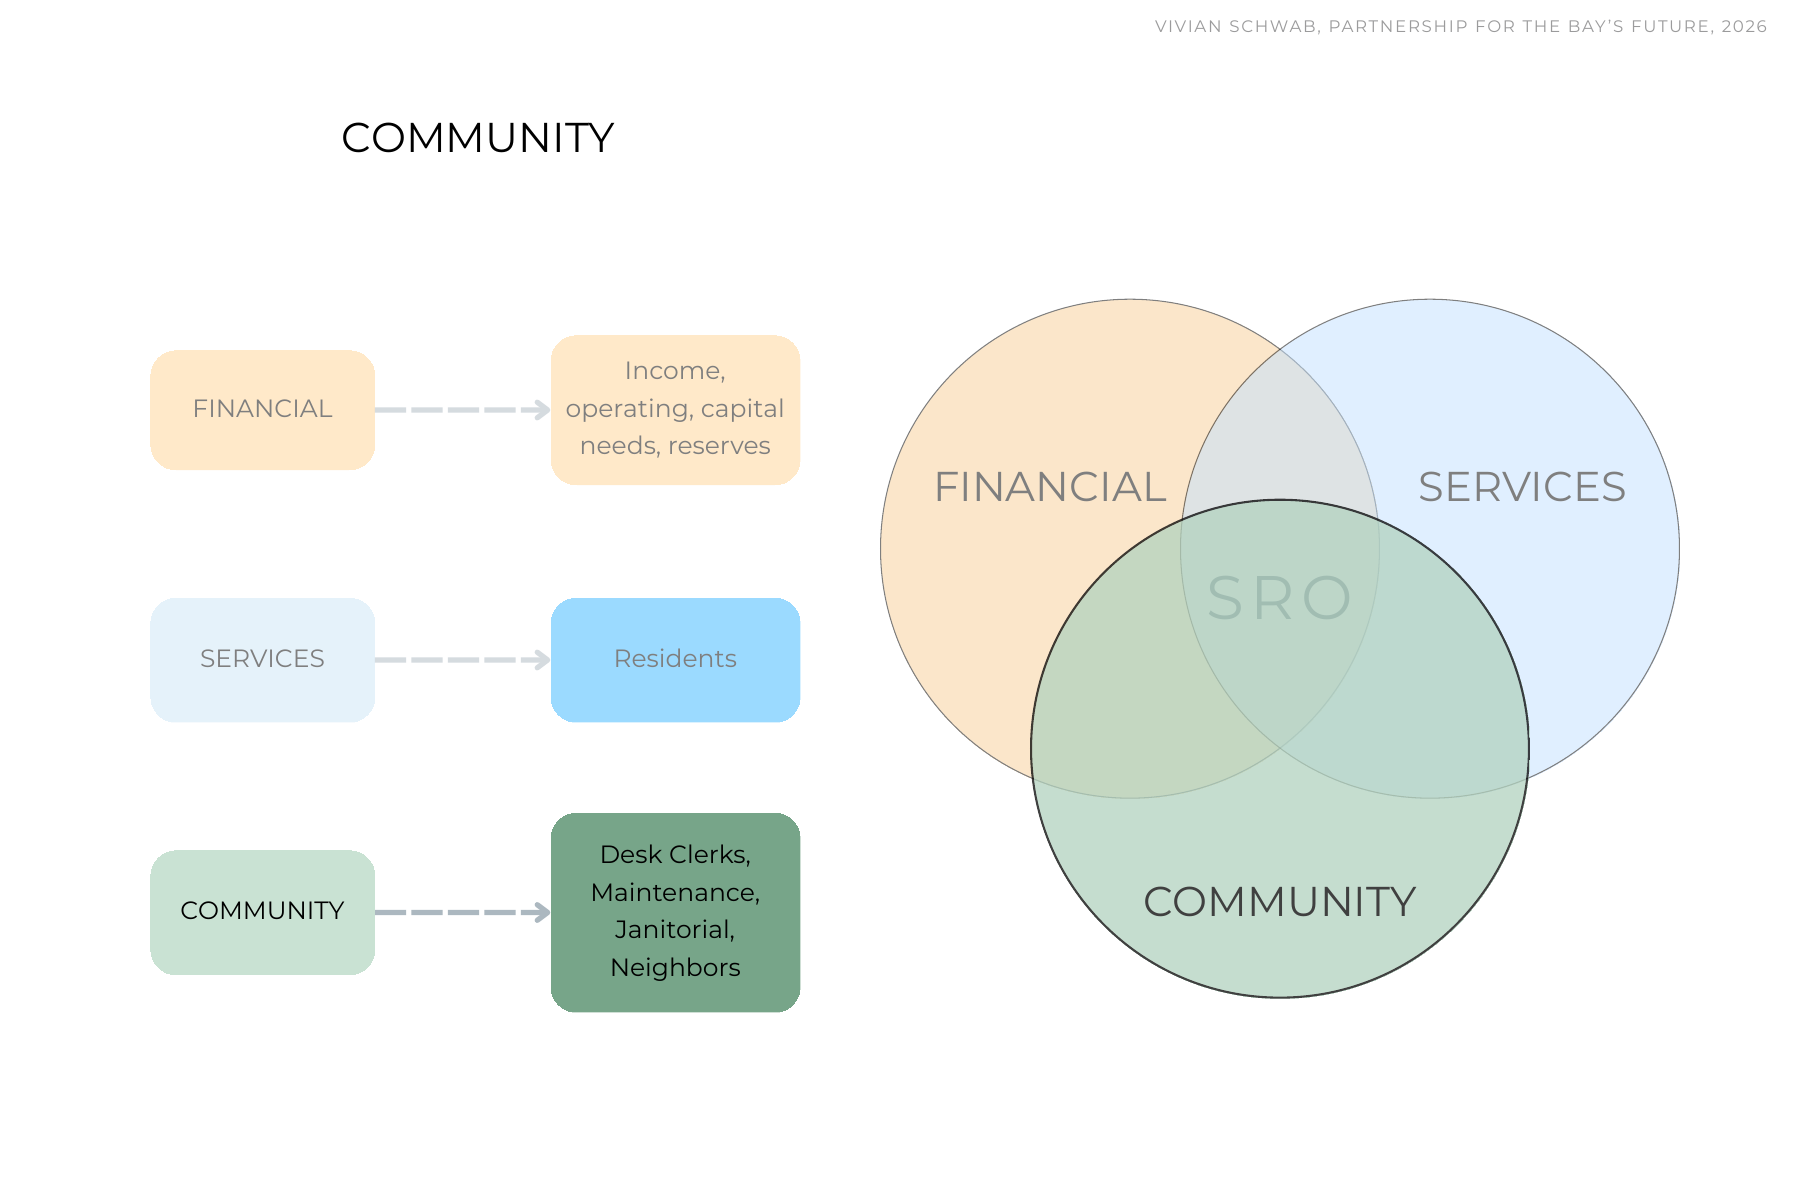
The third system is the one we fund least deliberately. By community I mean the people who work in these buildings, the property manager, the desk clerk, the janitor, and the relationships among the people who live there. Right now, it's where the unfunded work ends up. The people in these roles absorb failures that begin at assessment, and their work is often invisible.
PSH contracts fund case management at roughly one case manager for every 25 residents. Because of turnover those roles are often vacant, and in mixed PSH buildings the ratio can double, because only a fraction of the units have services attached. In that 200-unit building, only half the units have services, so the contract may fund four case managers for 100 people. The other 100 people don't stop having health crises, benefits problems, aging needs, conflict, or isolation because there's no service line in the budget for them. The building ends up with 100 formal clients and another 100 informal ones.
When a funded position is vacant, the work doesn't stop. It moves to the desk clerk, the property manager, another employee, sometimes the resident next door.
It's also about investing in the people in those roles. Comparing budgeted salaries for identical frontline job titles across HSH-funded SRO supportive housing providers, the same desk clerk job is budgeted from about $39,000 to about $66,000 a year, depending on the provider. Case managers and janitors show the same spread: same title, same kind of building, same work, up to 1.7 times the pay. At either end it's a hard wage to live on in this region, and the people I interviewed described moving to whoever pays more and provides more support and supervision. The lowest-paying, least-resourced positions are where holding onto staff is hardest.
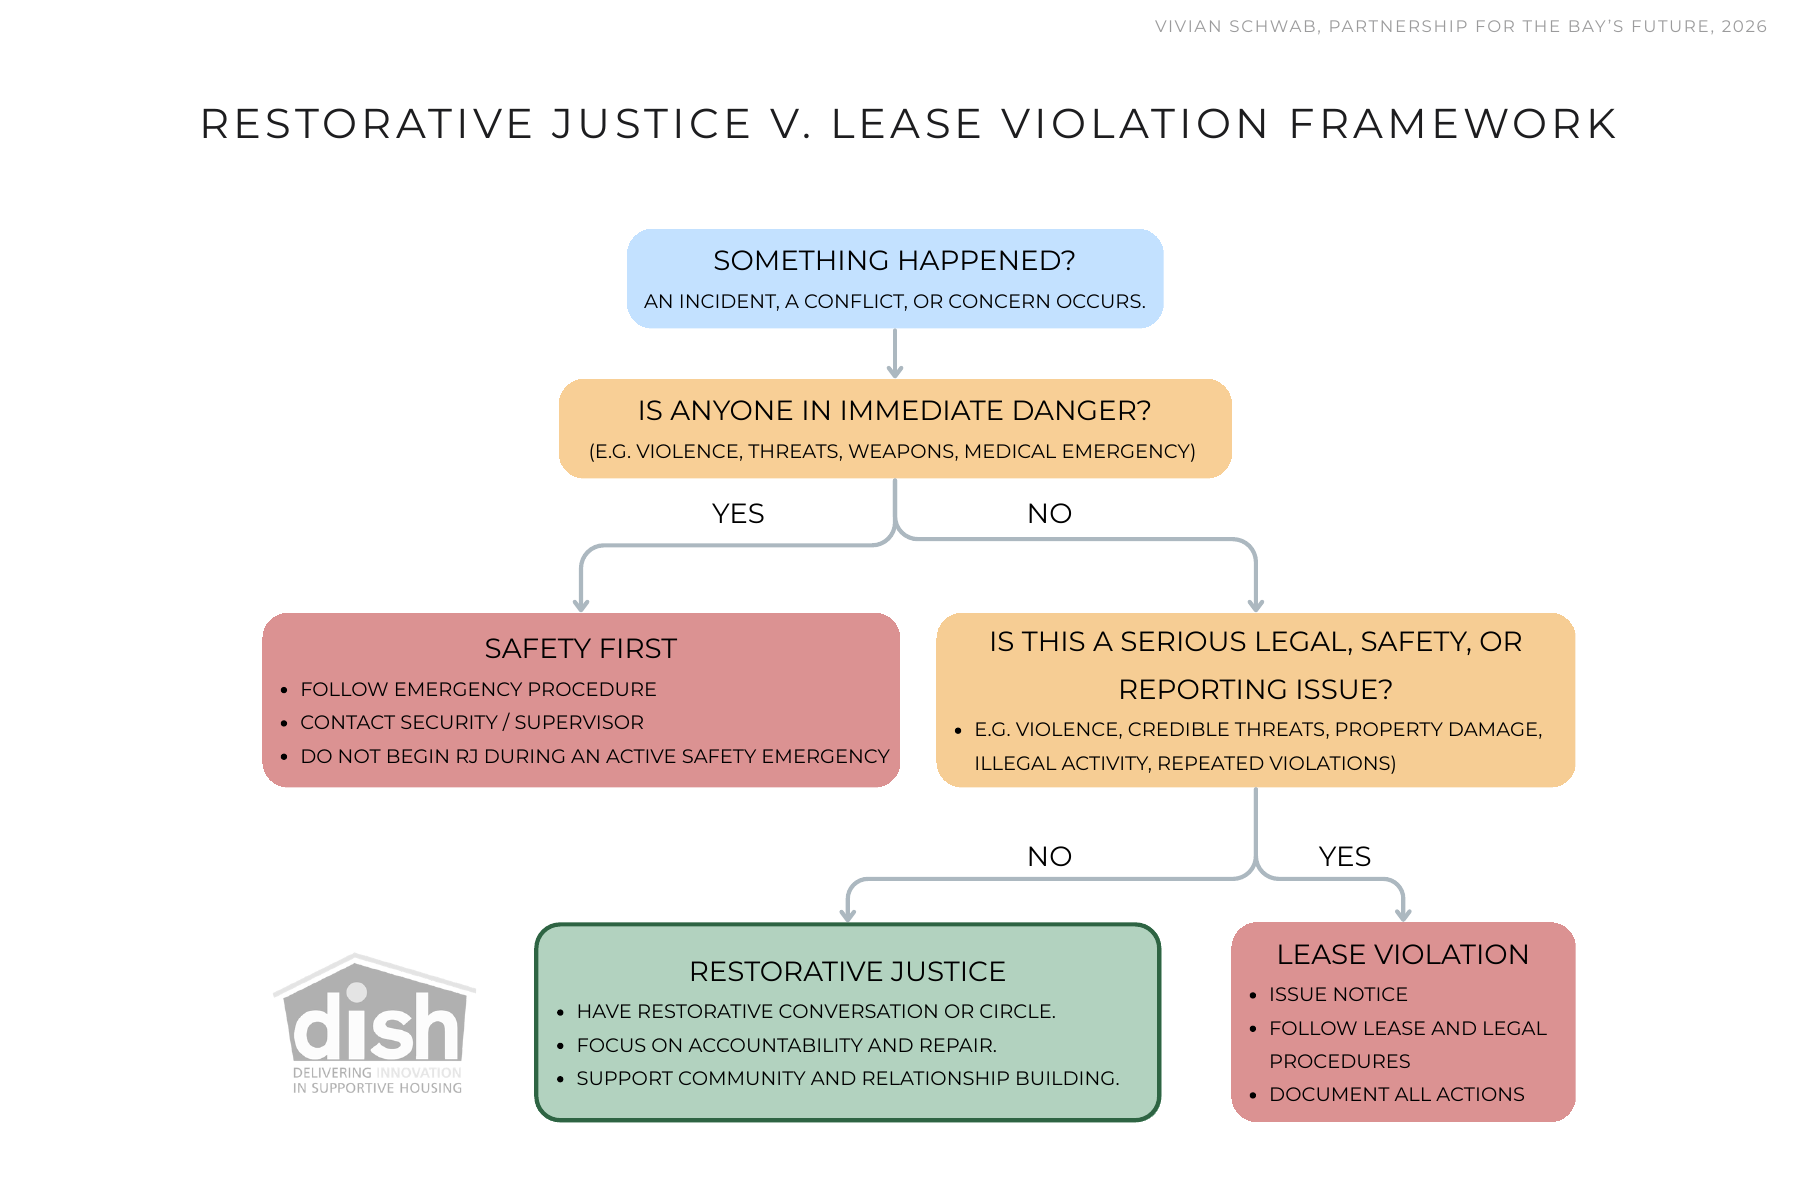
DISH has been building one version of investing in community: an incident-response framework that treats the stability of the building community itself as part of the intervention, not just a choice between legal and non-legal response. Shared living doesn't create community on its own; it has to be built deliberately.
The framework starts with safety. Emergencies follow standard procedure, and restorative practice does not begin during an active safety emergency. Serious legal, safety, or reporting issues still go to a lease violation. Everything else can go to a restorative conversation or circle focused on accountability and repair. It's early, and the evidence so far is observational, but responses after serious incidents have differed and staff support and morale are up.
This is in addition to the legal process, not a replacement for it. It is not about removing accountability. It is about creating more than one form of it.
What changes when you treat the stability of the building community as part of the intervention? Shared living doesn't create community on its own; it has to be built deliberately, and a legal or property-management response alone wasn't enough. DISH's restorative justice pilot pairs trauma-informed practice with staff and resident training and peer responders who give residents a role. It is still early and the evidence is observational, but responses after serious incidents have differed and staff support and morale are up. It also ties to the workforce: a stable environment is what makes supporting residents possible.
One building, three balance sheets
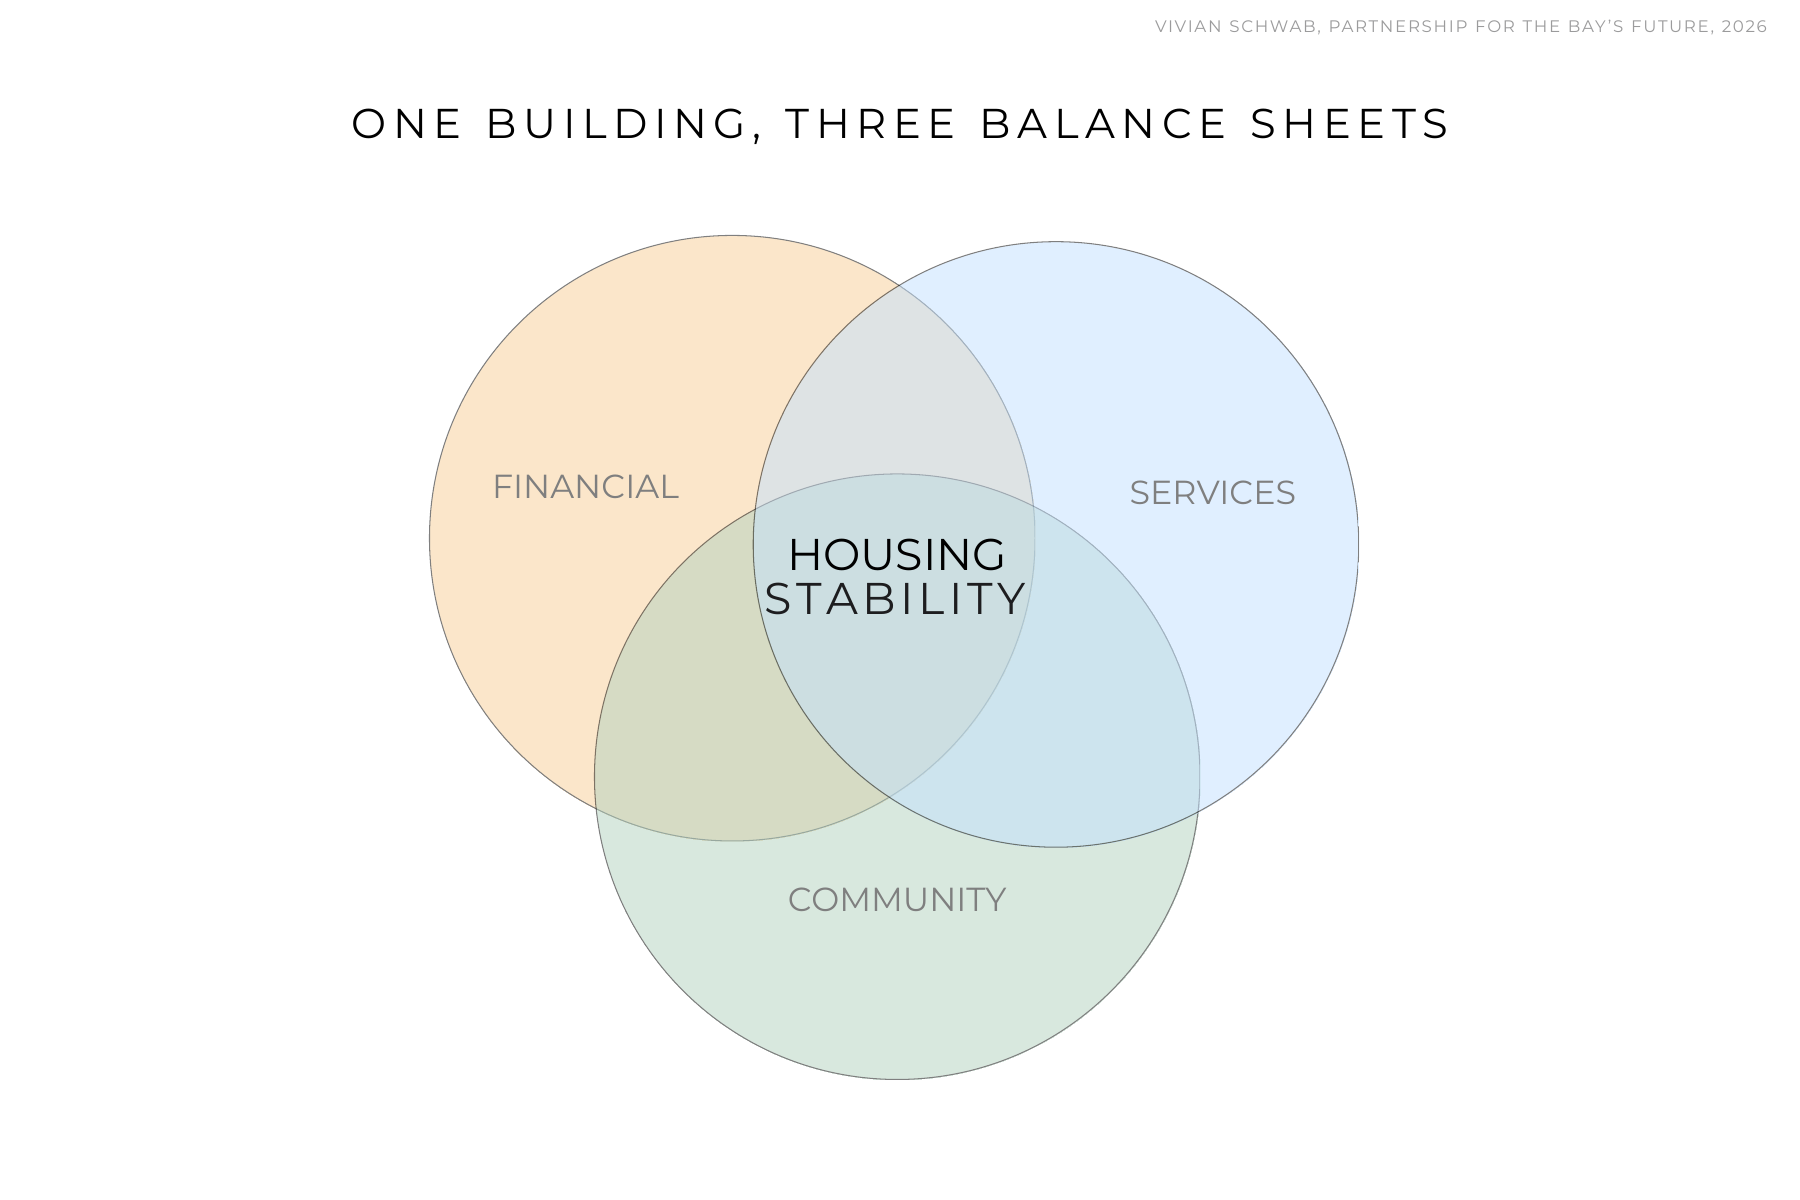
So what would it take to stop moving the cost around?
Financials. Operating funding benchmarked on what buildings actually spend; escalators and multi-year terms; support for units with no subsidy; a pooled capital reserve, so a single fire or flood doesn't land on one building's budget alone.
Services. Case conferencing before placement as standard practice; shared indicators, so we agree on the outcomes to avoid and learn from every incident; a housing ladder for residents who stabilize, such as moving-on vouchers and stabilization units; and shared accountability for filling vacant units.
Community. Staff pay standards; attention to turnover and training; and restorative practice as standard procedure alongside lease enforcement rather than a special program.
One recommendation I heard often in interviews was shared data. A building's financial condition, its physical condition, its residents' needs, and its staffing sit in different systems in different agencies, so you can't see a building sliding until it's already in crisis. A shared data backbone, and a portfolio-wide ranking of building condition, would let us see it earlier.
These interventions aren't new costs so much as costs we're already paying, later and in the wrong place.
I started this work thinking preservation meant preserving the real estate, and it does. But it turns out to require something larger. A newly renovated building can still fail operationally. A person can be successfully housed and still lack what they need to remain stable. A resident can stabilize enough that they no longer need supportive housing and still have nowhere affordable to move. A provider can hire extraordinary staff and burn them out by asking them to absorb the failures of an under-resourced system.
The outcome we're trying to produce is healthier residents, stable housing, safer buildings, a workforce that can sustain the work, and fewer crises spilling downstream into hospitals, courts, shelters, and the street. So when we ask what it costs to preserve this housing, the answer has to include more than the building. It has to include the resident, and the people and relationships that make the community function. These are not competing investments. They are infrastructure of the same housing system.
When one of them is underfunded, the cost doesn't disappear. It moves.